

Business quality is the most important factor when making long-term investments, but unlike growth or value, there isn’t a single metric that best reflects what quality is.
Historically, investors relied on return on invested capital (ROIC) and free cash flow (FCF) margin, but as time has proven, there are many examples of companies that once had a high ROIC, only to decline a few years later due to industry cycles, limited pricing power and new competition due to low barriers to entry.
I’ve been thinking of ways to assess quality in a simplified way better and have created a 10-category low, medium, or high score quality table.
To explain how this works, I will utilise 10 of Warren Buffett’s famous investments and then discuss how the companies we have so far assessed on Global Outperformers perform on the same quality table.
The 10 quality attributes
Quality companies have many attributes, and while some are more important than others depending on the industry, geography or macro context, I believe the following ten attributes reflect most of what we look for in quality companies:
Barrier to entry
Switching cost
Purchase frequency
Mission-critical
Technology resilience
Value chain control
Pricing power
Balance sheet strength
Profit margin
Test of time track record
The quality table measures each of these attributes into three categories, low, medium or high and depending on the number of attributes in ‘low’, companies are either classified into:
Ultra-high quality companies: These companies don’t have any attribute with a low score
High quality companies: They have only 1 or 2 quality attributes with a low score
Moderate quality companies: They have 3 quality attributes with a low score
Weak quality companies: They have 4 quality attributes with a low score
No quality companies: They have 5 or more quality attributes with a low score
The biggest limitation with this classification is that judging whether a company is low, medium or high still requires qualitative analysis.
The final column, growth, you’d notice in green, is similarly classified as low (<10% earnings growth potential), medium (10-15% earnings growth) and high (>15% earnings growth), and adds context for the quality table analysis.
To put this test into action, let’s next review 10 famous Buffett investments. On average, these ten companies returned 32% CAGR over the following five years after Buffett invested in them, with an average purchase P/E multiple of 11x.
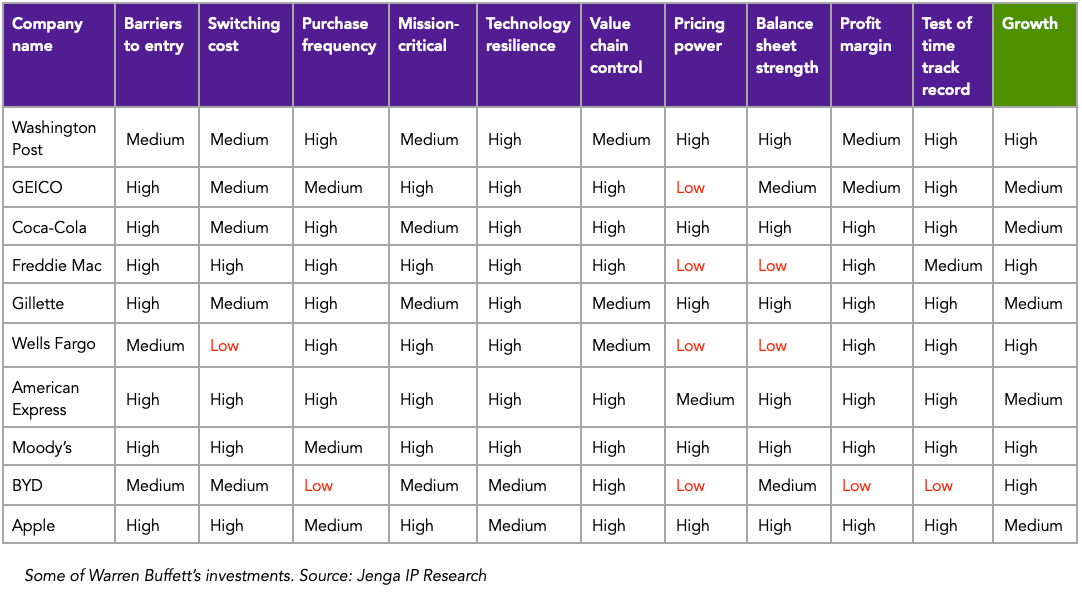
Ultra high quality (6/10 companies): Unsurprisingly for Warren Buffett, 6 of his 10 investments fell into the ultra high quality group with no single quality attribute with a low score. Buffett paid a higher than his average multiple for these companies at 15x P/E versus 8x P/E for the remaining 4 companies. On average, these 6 companies returned 34% CAGR in the five years after his investments. Finding these ultra-high quality companies at 15x P/E is extremely rare, and my further research showed that one could still achieve high returns paying 20-25x for these same companies, as long as they maintain medium growth prospects.
High quality (2/10 companies): GEICO and Freddie Mac were both in the high quality category due to the shortcomings in pricing power and balance sheet strength for Freddie Mac. Note that Freddie Mac’s balance sheet weakness later impacted shareholders during the financial crisis. More on this shortly. These high quality companies still proved to be long-term winners, but compared to ultra high companies, Buffett paid much lower multiples of 8x P/E to account for their risks.
Moderate quality (1/10 company): Wells Fargo was the only company classified as a moderate moat company with 3 quality attributes, switching cost, pricing power and balance sheet strength in the low score category. Buffett paid an even lower multiple of 7x P/E and demanded faster earnings growth from Wells Fargo to account for the quality shortcomings. Over the following ten years, Wells Fargo grew its net earnings at 26% CAGR, with its shares delivering an impressive 23% CAGR during the ten years.
Weak quality (1/10 company): BYD was the only company in the weak quality category, and ironically, this was the only company Buffett himself didn’t directly invest in. At the time of the investment in BYD in 2008, it had a limited test of time track record, low profit margins, infrequent customer purchases for batteries and later electric vehicles and limited pricing power. While Buffett’s entry multiple of 11x was higher than what he paid for in moderate- and high-quality companies, he was compensated by BYD’s exceptional growth of 26% net profit CAGR over the 16-year holding period.
No quality (0/10 company): None of the 10 Buffett companies was classified as a no quality company, and in line with his mantra of good companies at fair prices, he totally avoided these no quality companies. As followers of the Buffett approach, we should also follow this lesson for long-term investments
Some other key takeaways
Quality + value + growth: As we saw with the Buffett examples, going down the quality chain requires one to demand more value (lower earnings multiple) and growth (faster earnings growth) to make up for quality shortcomings. BYD was of much lower business quality than Coca-Cola, and in return, it had to grow even faster to make up for the quality gaps.
Ultra-high quality companies: These companies are extremely rare, and as we saw with the Buffett examples, when found with medium or high growth prospects- Coca-Cola grew at 13% CAGR for a decade, Washington Post grew at 20% CAGR for a decade- they have extremely high total return potential. It took Buffett 43 years to find 6 of these companies, averaging one new Ultra-high quality idea every 7 years. This is a reminder of the patience true high quality and long-term investing requires.
Quality score changes: During the 1970s, the Washington Post initially had a high technology resilience, pricing power and growth score, but by the 1990s, each of those attributes fell to low scores, and the return potential similarly declined. The lesson here is that we must continually assess quality and growth attributes to maintain attractive long-term returns.
Deal breakers: There were likely several potential investments Buffett considered but didn’t invest in because the low score in one of these 10 categories overrode any investment case. An example was his decision to sell Freddie Mac when he concluded he could no longer understand their balance sheet at the start of the 2000s. Sometimes, these low scores override any investment case, and like Buffett, we must think quite deeply about how bad a low score is when making any investment case.
Using the same framework, I have applied the quality table to the 15 companies we have so far deep dived on Global Outperformers and discuss them below.
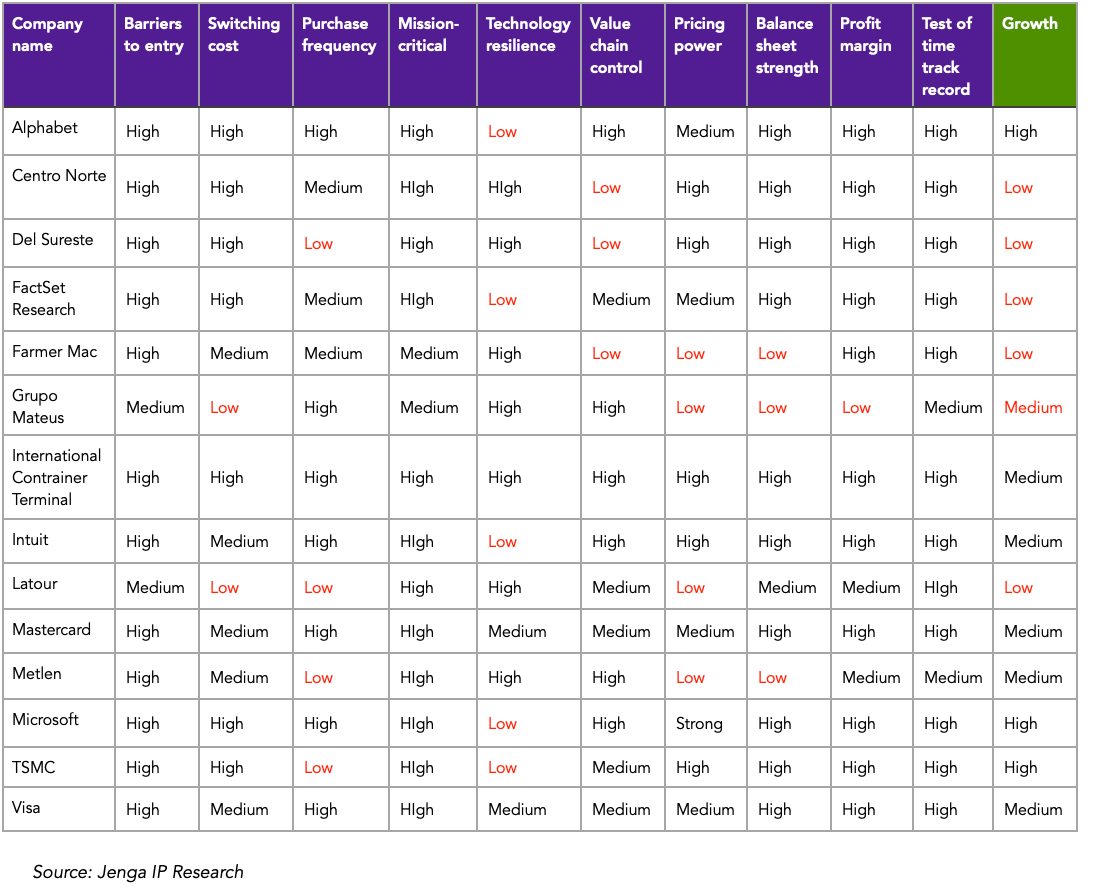
Ultra high quality (3/14 companies): Visa, Mastercard and International Container Terminal (ICTSI) each met the ultra high quality hurdle, but using the Buffett P/E standard, only ICTSI meets this as it was valued at 15x P/E at the time of our deep dive. Visa and Mastercard were each valued in the 28-30x P/E range, and it’s unlikely to expect those returns here.
High quality (7/14 companies): Most of our deep dived companies fell into the high-quality category, but unlike Buffett’s investments, 5 of them have low scores in technology resilience. The Mexican airports, ASUR and OMAB, and FactSet also fall short on the growth prospects rating, with low scores here. Given we also paid higher multiples around 13-20x P/E for these companies, we also can’t expect the Buffett like returns here.
Moderate moat (3/14 companies): Farmer Mac, Metlen and Latour each had 3 low quality attributes, and to account for their shortcomings, we first ensure there’s no technology resilience risk and pay only low P/E multiples of 9-10x for them. We should also include a growth hurdle of medium or high to ensure the low quality categories are well compensated for in the overall investment equation.
Weak moat companies (1/14 company): Unsurprisingly, the worst performing company to date was also the only company with a weak moat score, Grupo Mateus. As we learned from Buffett’s examples, weak moat companies should be avoided in nearly all cases and only purchased when the growth prospects (BYD at 23% 16-year CAGR) are extremely attractive.
Concluding thoughts
There are several limitations to the quality table discussed above, and by no way should this replace thorough fundamental research. I view this table more as a reality check on potential investments to minimise potentially bad outcomes. For example, in the future, should a company have more than 2 low quality categories, it must have low valuations (<15x P/E) with medium or high growth potential if we are to expect attractive returns.
I plan to incorporate the lessons here even more, particularly the deal-breaker lesson discussed above when a low score might be too poor that it overrides any potential investment case. From past deep dives, both Grupo Mateus and Metlen are under further due diligence and monitoring from a balance sheet strength lens. As we will discuss in the next deep dive, Adobe could be in this category from a technology resilience assessment.
1. The deal-breaker lesson: when a low score might be too poor that it overrides any potential investment case is a crucial takeaway in the analysis.
2. In addition, there might need to be consideration for a cut-off mark on current high P/E of a potential investment, in relation any possible compensating growth prospect.