

S&P Global, a financial services conglomerate in credit ratings, indices, energy and financial market data, has evolved over the past decades into one of the highest quality companies of all time. Few companies have survived in public markets for 50 years, let alone compounded their share price by 15% annually (with dividends reinvested).
Yet, despite the well-appreciated business quality, over the last 20 years, S&P Global’s earnings multiple has swung across 7x, 15x, 25x and 50x P/E (GAAP net earnings), demonstrating that opinions on its valuation still vary.
7x P/E (2009) - Then, still a division under McGraw-Hill, its shares fell by 73% between February 2007 and 2009 after playing a central role in the rise of toxic mortgage-backed securities during the financial crisis.
15x P/E (2012) - In the middle of its transition from publishing-led to financial services only, with the sale of McGraw-Hill Education, markets became nervous about the full exposure to the financial industry cycle and kept S&P Global’s market valuation in line with markets.
25x P/E (2016) - For the first time in 10 years, investors rewarded S&P Global with a premium multiple. It had just completed the transition to S&P Global as it is known today.
50x P/E (2024) - Acquisitions like IHS Markit pushed optimism upwards, and S&P Global gained the “serial acquirer premium”, pushing its earnings multiples to record highs.
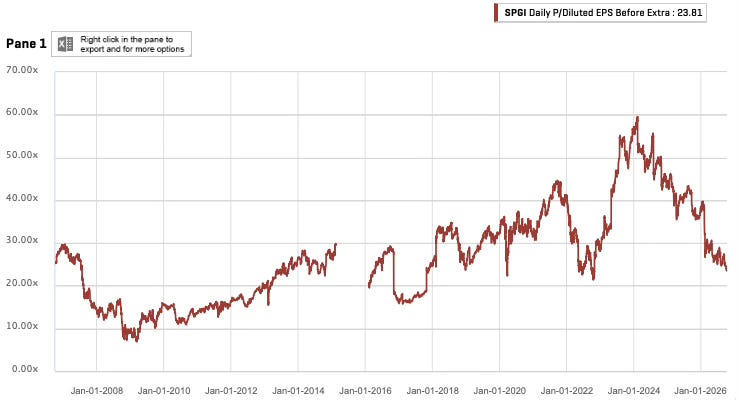
The market swing from 7x to 50x P/E between 2009 and 2024, and now to 23x today, is a useful reminder that valuations can still vary widely even for well-known and covered companies.
Market capitalisation (As of 5th October 2026): $113.9 billion
Jenga IP 2030 estimated market cap (including shareholder distributions): $203.5billion
Potential IRR (including dividends): 14.7%
Jenga IP Quality rating: 83.1/100
Answering the question of what S&P Global is worth requires us to dig below the headlines and understand what drives its earnings, how valuable its proprietary data is, and what risks the credit ratings and indices industries face.
To answer these questions, I will explore the following:
Table of contents
History of S&P Global: An overview of the key companies and people that shaped S&P Global, the transition of McGraw-Hill Financial to S&P Global, case study insights from the 1990s tech bubble and financial crisis and the state of S&P Global’s barrier to entry and test of time.
S&P Global’s product suite: A review of major products across the four divisions and Global Mobility, assessment of their competitiveness and AI resilience, contribution to the group’s revenue, their margin and key customers and an up-close comparison to Moody’s.
Credit rating and the Index industry: A global and regional perspective of the credit rating industry (U.S., Europe, UK and Asia), the business economics of ratings and key drivers of growth and cyclicality. The index industry’s value chain, embeddedness to passive investing, economics and competition for flows and capital. An overview of the Indian credit rating market and an introduction to CRISIL Limited.
Market Intelligence and energy market data: Analysis of the energy price reporting agency (PRA) industry, Platts position in each category and CERA’s competitiveness relative to peers like Wood Mackenzie. An overview of the financial market data industry and S&P Global’s Market Intelligence competitiveness relative to peers, market share and an assessment of key industry trends.
The AI impact and opportunity: Assessment of products and business lines most exposed to AI and AI-influenced competition, proprietary data points value in the AI risk defence and an overview of S&P Global’s AI efforts and monetisation.
Business Economics: A breakdown of S&P Global’s revenue and cost structure among its four segments (Market Intelligence, Ratings, Indices and Energy), a 10-year analysis of their profitability and cost structure changes and business drivers. A unit economics analysis of a major S&P Global customer (BlackRock), $1 billion in ratings issued volume and indices AUM unit dynamics, among others.
Growth potential: A 5-year analysis of S&P Global’s revenue, costs and EBIT projections, assessment of organic, M&A (potential M&A targets included) and cost savings to EBIT during the period and how market cyclicality is factored into S&P Global’s earnings projections.
Risks: Review of its exposure to financial crisis, product liability and abrupt interest rate changes. Concluding thoughts on S&P Global’s AI exposure and a summary of S&P Global’s high quality position.
S&P Global valuation: An earnings multiples perspective of S&P Global’s 2030 IRR and rationale behind key assumptions such as exit multiple, net income and free cash flow generation.
CRISIL Limited valuation: An earnings multiple analysis of CRISIL, factors driving its growth and the valuation model, potential IRR and purchase price target.
Mobility Global valuation: An earnings multiple valuation model of Mobility Global and an overview of its potential IRR.
Conclusion: Final thoughts on S&P Global’s moat and portfolio review to account for S&P Global. Valuation for Kensho perimeter potential sale.
1. History of S&P Global
Objective: Understanding S&P Global’s test of time (a quality attribute), how it got to its current product portfolio and clues we can learn from the past on capital allocation for the future.
McGraw Hill Education, McGraw Hill Financial and then S&P Global.
It’s changed its name over the years, bought and later sold the same assets, prioritised, deprioritised and then later again prioritised divisions like credit ratings, among many other confusing, complex corporate decisions. For many, S&P Global might seem like a complex spider web, and for this reason, it’s important to first review how it arrived at its current business purpose and portfolio of products. To do this, I’ll summarise its business history into three periods:
1860 - 1966 (Poor’s Publishing to McGraw Hill)
1966 - 2009 (McGraw-Hill to McGraw Hill Financial)
2009 - 2016 (McGraw-Hill Financial to S&P Global)
1860 - 1966
A spider web of different companies launched and merged to create S&P Global as we know it today. Five of these companies form the backbone of S&P Global today:
Poor’s Publishing (1860)
Today, we have AI, but in the 1860s we had railroads and industry. As investors poured capital into the railroad companies, there was strong demand for a central financial database of the companies as they sought to navigate the boom-bust cycle. After purchasing the American Railroad Journal and becoming its editor, Henry Poor founded Poor’s Publishing, a directory detailing the financial state of the companies. He later left to become the first secretary of Union Pacific, then a newly created company and today’s second-largest American railroad company.
Standard Statistics (1906)
At the turn of the century, the industrial sector was increasingly diversified beyond just railroads, and Luther Lee Blake saw the market gap for non-railroad financial information, founding Standard Statistics in 1906. His approach was quite different. Rather than publishing a book as his predecessors did, Luther Blake focused on issuing financial data cards on the companies and can be viewed as the Bloomberg of the 1900s.
Both of them were, however, slow to recognise the real market opportunity: bond rating. John Moody, the founder of Moody’s, having sold John Moody & Company after exposure to the panic of 1907, launched a new financial data business and offered opinions on railroad securities and assigned letter-grade ratings to their bonds (1909). The rating system proved very valuable for investors short on time, and in the following years, both Standard Statistics and Poor’s Publishing would follow suit, establishing the credit rating industry.
Compared to using investment banks, investors felt more aligned with these credit rating companies and, over time, their demand quickly grew, and they established their position as the go-to source for credit rating opinions.
At that time, the industry had an investor-pay model, rather than issuer-pay as done today, leaving the ratings companies quite cyclical and lumpy. As a result, a wave of mergers and acquisitions occurred, and in 1941, Paul Babson, who had acquired Poor’s Publishing after its bankruptcy in 1933, merged it with Standard Statistics, creating Standard & Poor’s Corporation.
S&P Indices (1923)
Prior to Standard Statistics’ entry into the index market, Dow had created the dominant index, initially the Dow Jones Transportation Average (1884), then later the Dow Jones Industrial Average (1896). The problem the Dow had was that it was price-weighted, and changing to market cap-weighted would fundamentally change the dataset, which created an opportunity for someone else to serve. Standard Statistics launched its Composite Index of 233 companies in 1923. After it merged with Poor’s Publishing in 1941, it expanded to 416 companies.
Then, as computing capabilities expanded, S&P transitioned from daily to intraday price computation and launched the S&P 500 in 1957. The rest is history.
Ratings are about analysis and certification. Although difficult, new competitors can still enter the market. Indices, on the other hand, are measurements, and once ingrained in the market, they become very difficult to disrupt. It would take years for a substantial new entrant in the indices business: Nasdaq in 1971.
Today, Dow Jones and S&P Indices merged through a joint venture with CME Group in 2012, creating one of the highest-moat and most profitable businesses of all time. More on this soon.
Platts Oilgram (1923)
Today, 15% of S&P Global’s revenue comes from data services for the energy industry, and its history goes back to National Petroleum News (NPN), a magazine started by Warren Platt in 1909. Similar to what we learned from Standard Statistics, NPN started as just market information on the petroleum industry, and as demand grew, the publication frequency increased, which caused Warren Platt to create the Platts Oilgram in 1923 as a daily newsletter.

A few years later, in 1928, oil majors, including Standard Oil, Shell and others, began using their data to price transactions in the international market, and over time, the price service became its own product, forming the basis of Platts as a reference index for the energy market. However, another organisation was instrumental in piecing these different businesses together, which moves to the next phase of S&P Global’s history.
1966 - 2009
McGraw-Hill (1966)
McGraw-Hill’s founder, James McGraw, also acquired a railroad publication, as Henry Poor of Poor’s Publishing had done. But rather than focusing on the financial information, James McGraw focused more on the technical information.
Again, as we saw with S&P, the boom-bust cycle forced companies to merge; McGraw Publishing merged with Hill Publishing, owned by John Hill, which also focused on technical publications. Later, they diversified, launching Business Week, one of the most important business publications (now owned by Bloomberg). As the education market grew after the 1930s, they expanded into college textbooks, other professional books, and eventually K-12 education books.
Then real diversification started, starting with Platts in 1953 (energy sector), F.W. Dodge in 1961 (construction sector) and Standard & Poor’s in 1966 (financial services sector).
McGraw-Hill’s own history is rich and deserves its own deep dive. From board infighting, family conflict, American Express’ attempt to buy them for $830 million in 1979, and then S&P’s involvement in the financial crisis. For the investment case today, I will leave these out.
The final business relevant to S&P Global’s investment thesis today is its purchase of Capital IQ.
Capital IQ (2004)
For years, S&P Global had watched the rise of financial data platforms like Bloomberg and Reuters from the sidelines and wondered how they could distribute all the data they had. The opportunity to purchase Capital IQ, the financial data platform founded in 1999, solved this, and S&P quickly integrated its data into the platform. Next, a wave of acquisitions was completed, such as Reuters database and Research-on-demand, leading to what we now know as the Market Intelligence division (32% of S&P Global’s revenue today).
2009 marked an important turn for McGraw-Hill. In the middle of the financial crisis, it decided to focus on its financial assets, letting go of the other two divisions, Education and Information & Media.
2009 - 2016
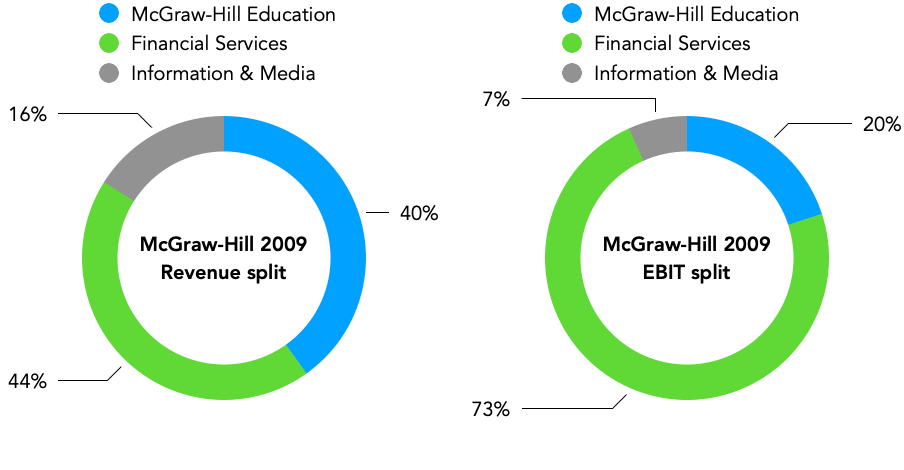
At the end of 1999, the financial services of the McGraw-Hill conglomerate represented 44% of the group’s operating profits, the largest segment despite having a smaller revenue share (31% revenue share) than the education segment (43% revenue share).
By 2009, even in a terrible climate for financial services, the division was still much better than others. Its 41% EBIT margin was nearly four times higher than Education’s 11% and Information & Media’s 10%. It accounted for 73% of its EBIT, and given this, it was clear to management where they needed to focus.
The next few years came with a wave of asset sales. First out was Business Week to Bloomberg in 2009. In 2010, its Australian secondary-education business was sold, then its television broadcasting assets in 2011.
After 2011, the strategy went from a select few to everything outside financial services. The whole education division was sold to Apollo for $2.5 billion in cash in 2012, Aviation Week in 2013, F.W. Dodge in 2014 and then J.D. Power for $1.1 billion in 2016. Cementing the focus on S&P and financial services was the renaming of the group to S&P Global in April 2016. I could have started the investment case history from here in 2016, but looking back across its long history provides clues about two Jenga IP quality attributes: test of time and new entry difficulty.
Case Studies
There are lots of companies with a fairly good track record in their test of time. Coca-Cola in product durability, Siemens in capability durability and ADP in customer-need durability are good examples. However, only a handful of companies have these different test-of-time traits, coupled with “real longevity durability”. What I mean here is that it survived different owners and managers and mistakes, and still thrives decades later.
A good case study is the financial crisis, when, on the outside, S&P Global seemed like it would fail.
Case study 1 - Quality (Test of time). Financial Crisis
Today, S&P Global is among the 40 largest listed financial companies, but in 2008, its market cap of $7 billion wasn’t among the top 150, and this was due to the negative sentiment towards the credit rating agencies. S&P Global’s inaccurate models for rating complex collateralised debt obligations (CDOs) and residential mortgage-backed securities (RMBS) played a key role in fuelling both markets, leading to the catastrophic downturn and the broader economic impact. The issuer-pay model was also put into question, a business model risk we will discuss further in the risk analysis (section 8).
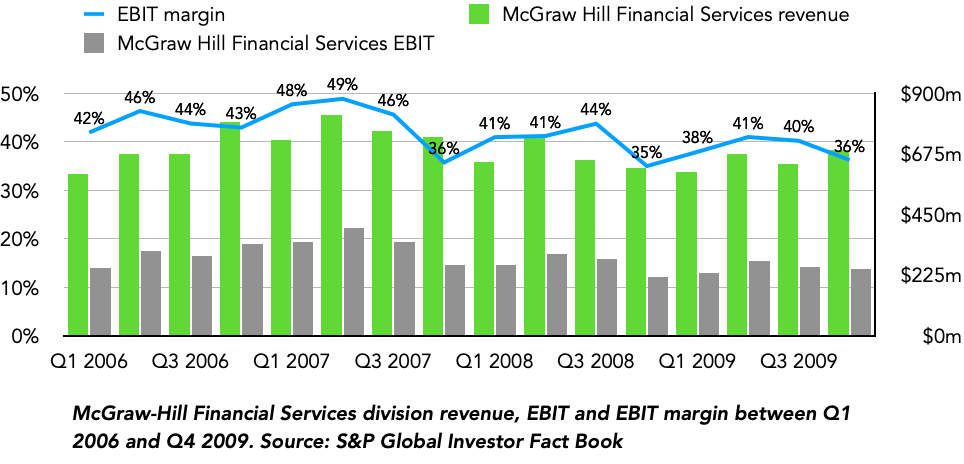
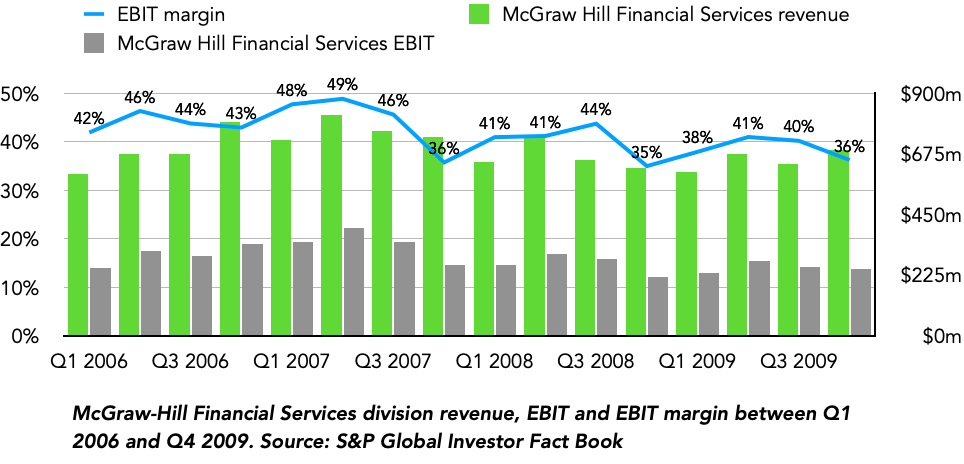
The setup was the perfect test of S&P Global’s business resilience, as we saw how its revenue and earnings coped in the worst conditions. The two charts below map out how the financial services division performed between Q1 2006 and Q4 2009. There are two key points I want to focus on here:
Product breadth: Most people knew S&P Global as directly correlated to the global debt market, and when the U.S. debt market collapsed from $3.3 trillion to $1.5 trillion between 2006 and 2009, the going assumption was its financial services revenue might fall by half. As shown in the chart below, this was far from what actually happened. Revenue declined by just 1.7% CAGR between 2006 and 2009 and held up well through the quarters. Part of this was due to the product breadth and diversification away from ratings. Capital IQ and all the newly pushed Market intelligence products had already reached 33% of the division’s revenue, while the highly important non-transaction revenue within credit ratings steadied during the crisis.
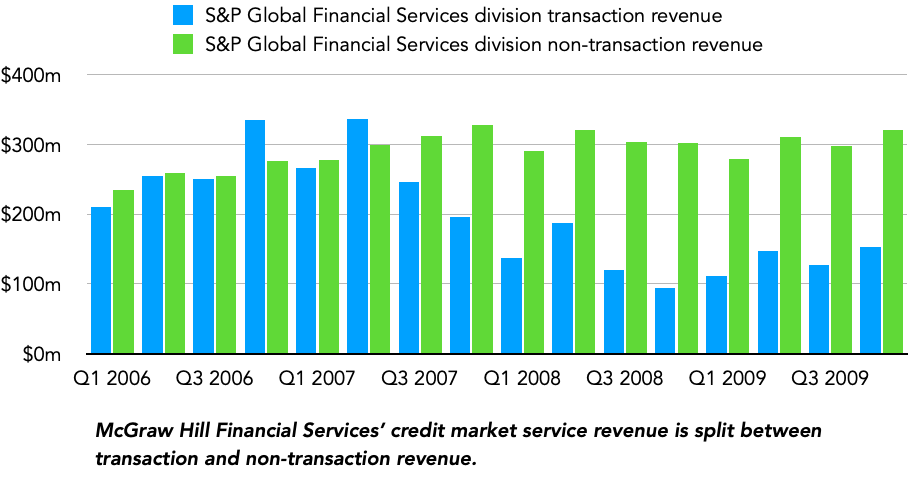
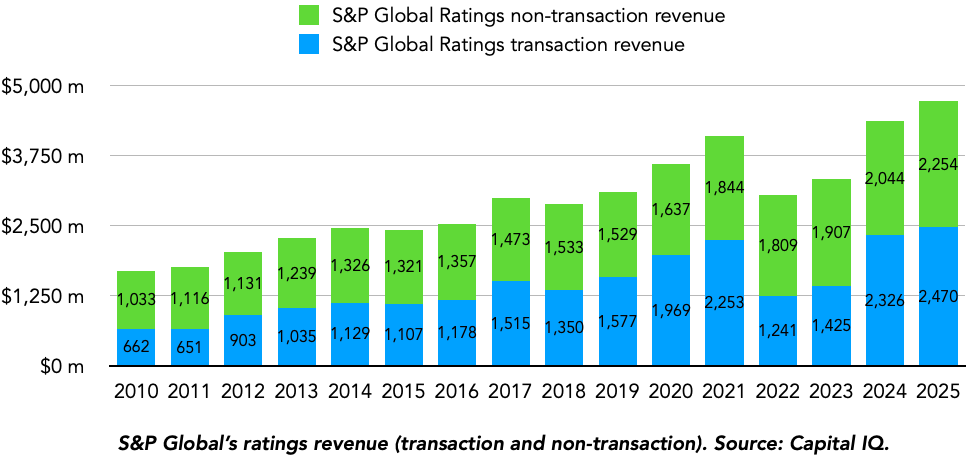
Transaction versus non-transaction revenue: The non-transaction revenue is the single most important reason that separates credit rating companies from other financial companies that make most of their revenue from new business volumes and one-off transactions, such as investment brokerage, investment banking and insurance premiums. As shown in the chart below, non-transaction revenue, that is, revenue from surveillance, monitoring, breakage fees and ongoing risk assessments, was already half of the ratings business, and grew by 5.7% between 2006 and 2009, despite the debt market falling by half in new issuance volume.
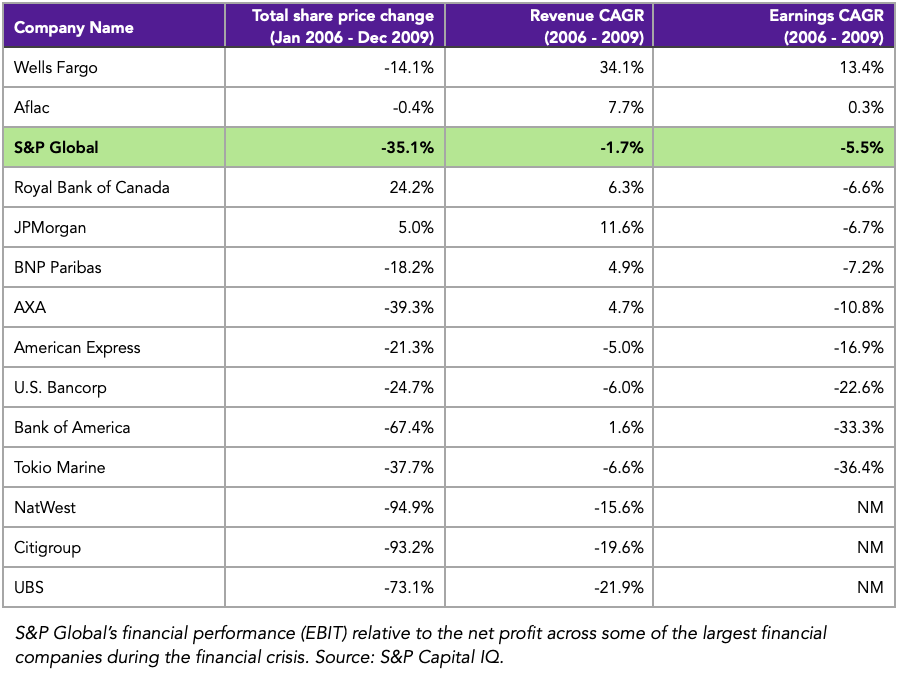
As shown in the table below, despite S&P Global’s share price decline during the financial crisis, its revenue and earnings held up much better than those of the broader financial market, with only Aflac and Wells Fargo performing better on an earnings basis. This is an important point we will return to in the growth analysis (section 7).
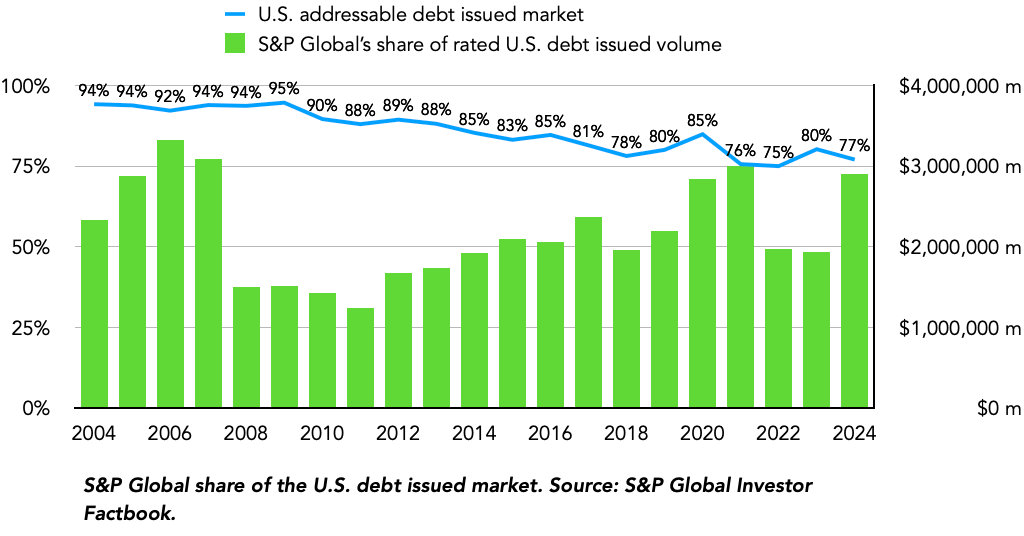
Each crisis and sub-market pullback by incumbents (S&P Global and Moody’s) often leads to new competitors emerging. The credit rating market has been no different. Since the financial crisis, Scope Group (European sovereign ratings), Dagong (Chinese credit rating), and Kroll Bond Rating Agency (structured finance and commercial mortgage-backed securities) have each stepped up competition against the dominant players. Although S&P Global’s share of U.S. issued volume has declined from 95% pre-financial crisis to 77% today (see chart below), it maintains a high share of issued volume covered in core markets like corporate debt: 99% in industrials (non-financial services), 100% in infrastructure and 94% in financial services.
The market share loss is largely concentrated in structured finance debt, where it has declined from 90-95% pre-financial crisis to 15-60% across RMBS, CDOs and ABS.
Case study 3 - Growth
Growth is part of the quality analysis, and between 1970 and the financial crisis, the growth opportunities for S&P Global were clear: enter new markets and ratings asset classes. In the 1980s, it entered municipal notes (1982) and European structured finance (1987), and entered new markets like the UK (1984) and Japan (1985). In the 1990s, growth extended to rating bank loans (1995), catastrophe bonds (1996) and CDOs (1997), while entering new regions like Germany (1992), Hong Kong (1995) and emerging markets like Brazil and Russia in 1998.
With all these markets covered pre-2010, coming out of the financial crisis, the key investor question for the ratings business was: where next?
As we studied during the Visa and Mastercard deep dive earlier in the year, when a company or industry is highly important to the global economy, sometimes it becomes advantageous to its pricing power, as they tend to grow above GDP growth. S&P Global is one of those handful of companies. As shown in the chart below, S&P Global’s ratings revenue grew at a 7% CAGR between 2010 and 2025, well above global GDP.
“Nominal GDP + debt/GDP + rated-debt penetration + refinancing velocity + S&P market share + pricing = S&P Ratings revenue growth”
When we combine the high barriers to entry, the necessity and mission-critical nature of S&P Global’s service, alongside the correlation between GDP growth and refinancing needs, corporate debt issuance and debt capacity, M&A, among other factors, one can expect the trend to continue in the future.
Beyond ratings, mergers and acquisitions like SNL Financial, IHS Markit and With Intelligence within Market Intelligence, CRISIL, India’s leading rating agency, where S&P Global maintains a 66.6% stake and Indices, another high-quality “GDP growth +3-4%” business given passive and equity markets growth, led to a 15-year revenue CAGR of 10% and operating earnings CAGR of 13%.
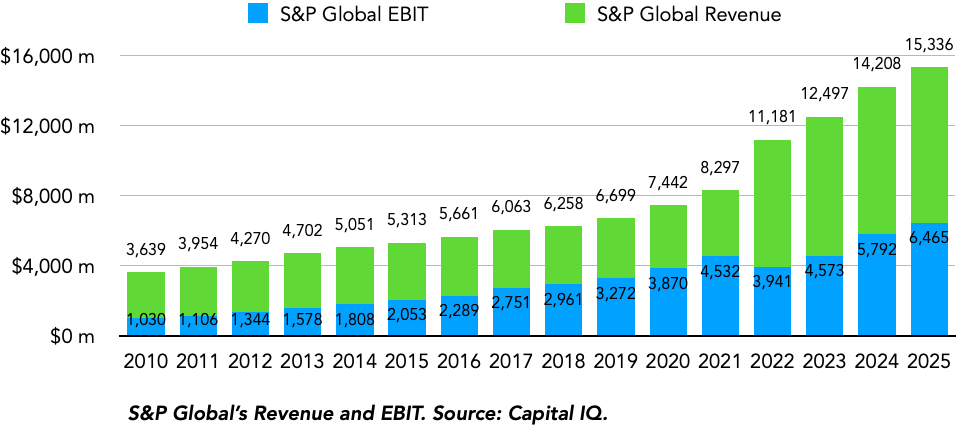
It might be tempting to assume similar growth levels for the future. However, any assumption about S&P Global’s growth potential and business economics requires a deep understanding and analysis of its current product portfolio, capital allocation and broader industry trends.
2. S&P Global Product Suite
S&P Global is a financial services conglomerate with five divisions as at the end of 2025. The spinoff of Mobility Global in July 2026 reduced its segment count to four. Still, across the four, I count more than 90 products, and to gain a deeper perspective of the value created for customers, I reviewed each of these, simplified them into 54 products, mapped out their customers, competitors and performance on the Jenga IP Product Assessment tool. You can access the spreadsheet here.
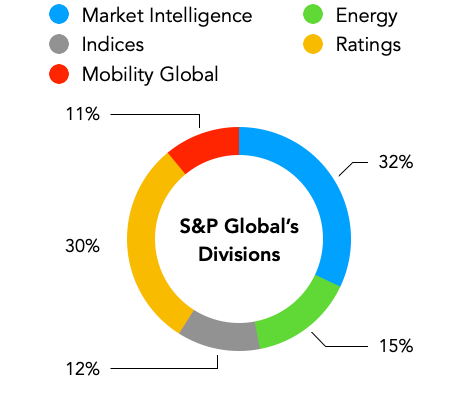
For each S&P Global segment, we can divide them into the following sub-divisions, supported by management’s own recent disclosures and my own estimates:
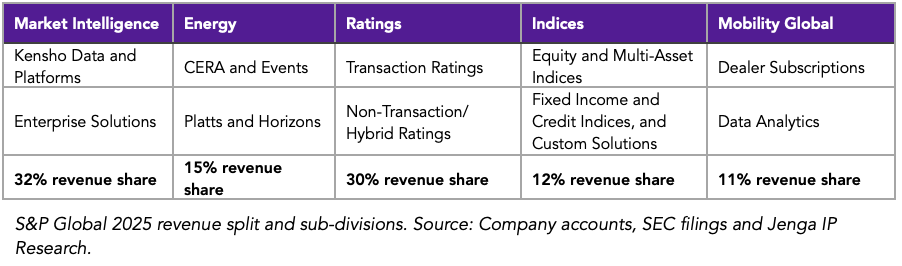
Market Intelligence: Kensho Data and Platforms and Enterprise Solutions
Energy: CERA & Events and Platts and Horizons
Ratings: Transaction Ratings and Non-Transaction/Hybrid Ratings
Indices: Equity and Multi-Asset Indices and Fixed Income and Credit Indices and Custom Solutions
Mobility Global: Dealer Subscriptions and Data Analytics
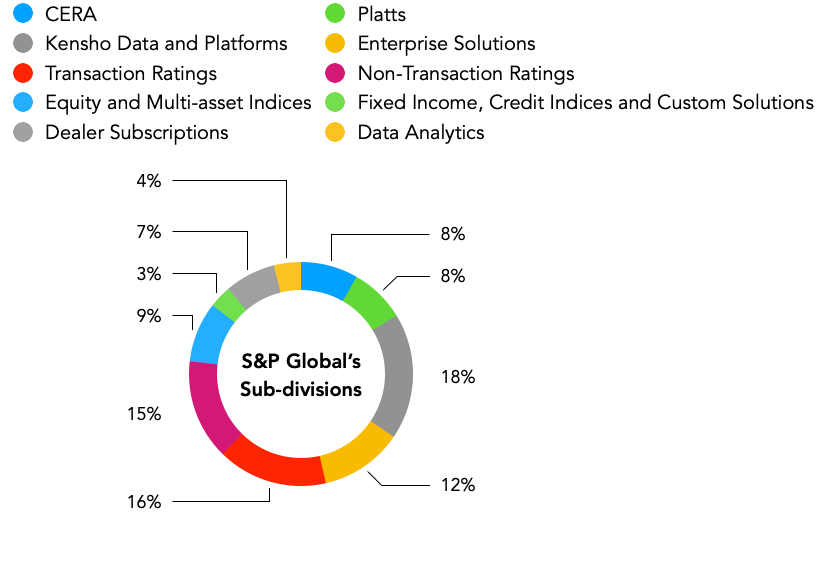
The chart below further splits the revenue into these ten subdivisions. As highlighted, the largest three are Market Intelligence’s Kensho and Data Platforms (18% of revenue), Ratings Transaction (16% of revenue) and Non-Transaction/Hybrid Ratings (15% of revenue).
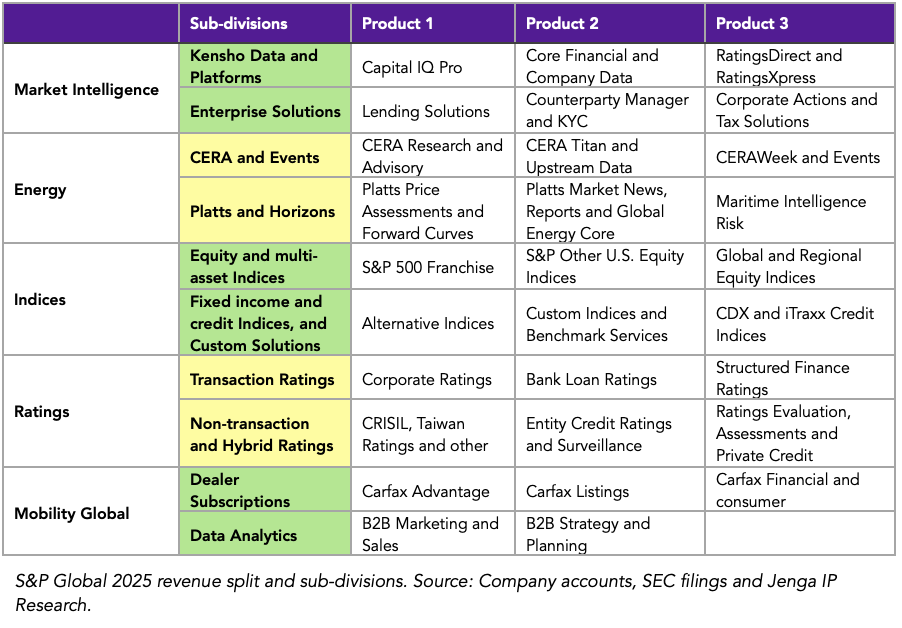
Next, let’s examine the product scope, functionalities and core features of some of these products for each division to gain a deeper perspective of S&P Global.
Market Intelligence (31% of S&P Global’s revenue)
Market Intelligence’s less proprietary data, greater competition and more limited pricing power constrain its operating margin relative to other divisions. It represents 15% of S&P Global’s 2025 EBIT (pre-Mobility Global spinoff).
Today, S&P Global divides MI into Kensho Data and Platforms (60% of MI’s revenue) and Enterprise Solutions (40% of MI’s revenue). Let’s review each.
Kensho Data and Platforms (60% of Market intelligence revenue)
Kensho Data and Platforms’ heritage dates back to its two most important products, Compustat (created in 1964) and Capital IQ (acquired in 2004).
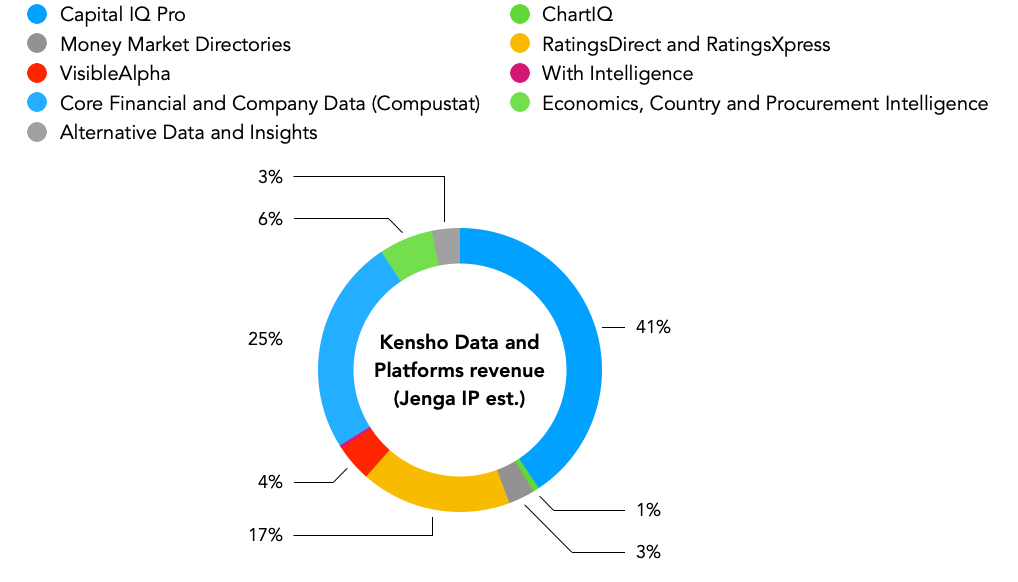
Product Insights - Compustat and S&P Capital IQ
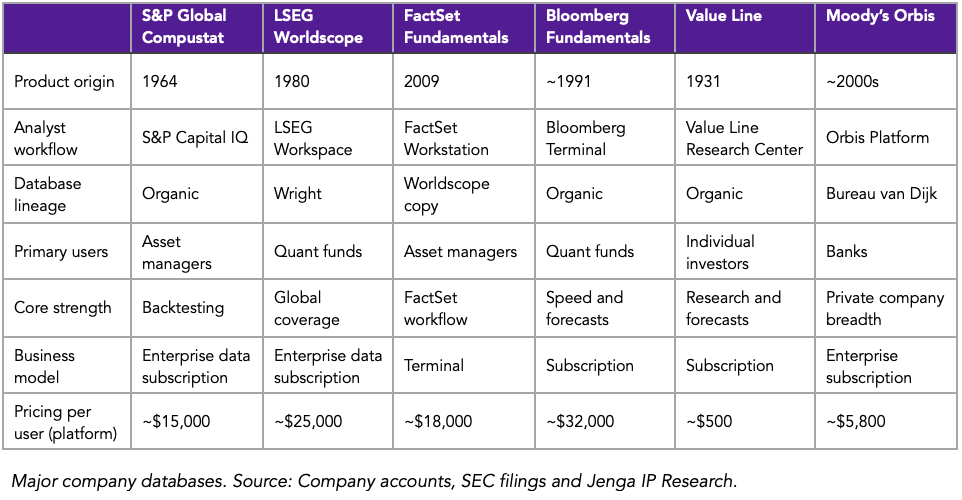
Compustat, created by H. Russell Morrison, was the first mover in using computers to standardise and access machine-readable corporate fundamentals. Initially, these were databases sold to investment banks and other financial services companies, but the entry of LSEG’s Worldscope, then under Thomson Reuters, FactSet Fundamentals and Bloomberg Fundamentals made the database less proprietary and unique to S&P, and the business model shifted primarily through financial data workstations owned by the same players in the database market.
To fill this gap in database platform distribution, S&P acquired Capital IQ in 2004, and today, it ranks fourth in revenue behind Bloomberg, LSEG and FactSet. The S&P Global database has also moved beyond just U.S. company coverage, as the original Compustat did, and the creation of Capital IQ Financials was pivotal in this. Other important datasets include:
GICS, a joint venture between S&P and MSCI, was created in 1999 for industry classification data.
The Ownership Dataset covers major shareholder filings.
SNL Financial, acquired in 2015, covers specialised datasets in the financial services, energy, metals and real estate industries.
VisibleAlpha, acquired from a consortium of investment banks in 2024, provides sell-side estimates for company fundamentals.

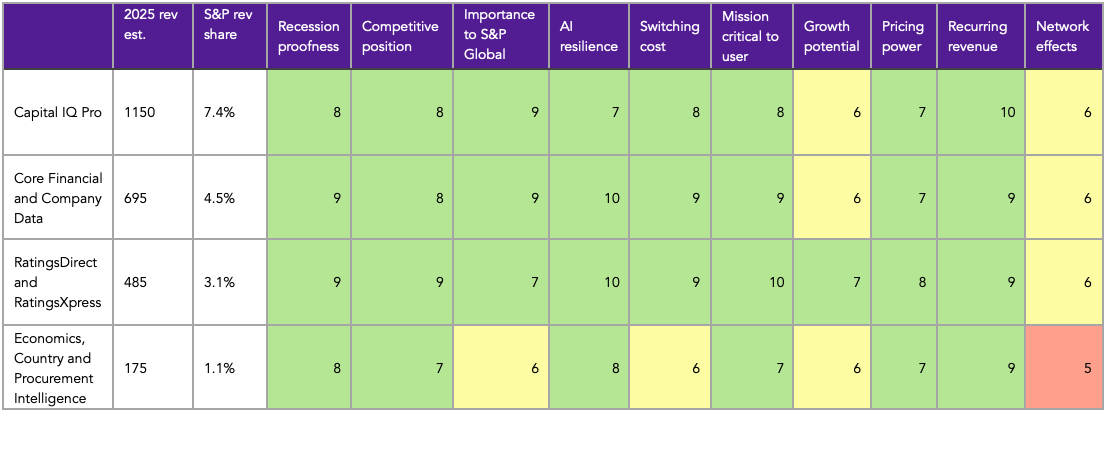
Today, Compustat, more broadly classified as the core financial and company data product in my table, competes predominantly with four other datasets, while Moody’s Orbis platform is more focused on private company datasets. As part of my earlier research on FactSet and the broader financial market data industry, the table below summarises the positioning of the major providers and while S&P Global’s Compustat & Capital IQ combination isn’t as premium as the Bloomberg Terminal & Fundamentals, or as low-cost as the FactSet Workstation & Fundamentals product, S&P has found its niche within customers focused on backtested U.S. data and continues to maintain its strength here.
A recent worry among markets is their defensiveness to AI, given the increased commoditisation of the datasets and lowered barrier to entry for users utilising their own datasets alongside API and MCP connectors with tools like ChatGPT and Claude. I will discuss the opportunities and challenges AI poses more broadly in section 5, AI opportunity and risks.
Enterprise Solutions (40% of Market Intelligence revenue)
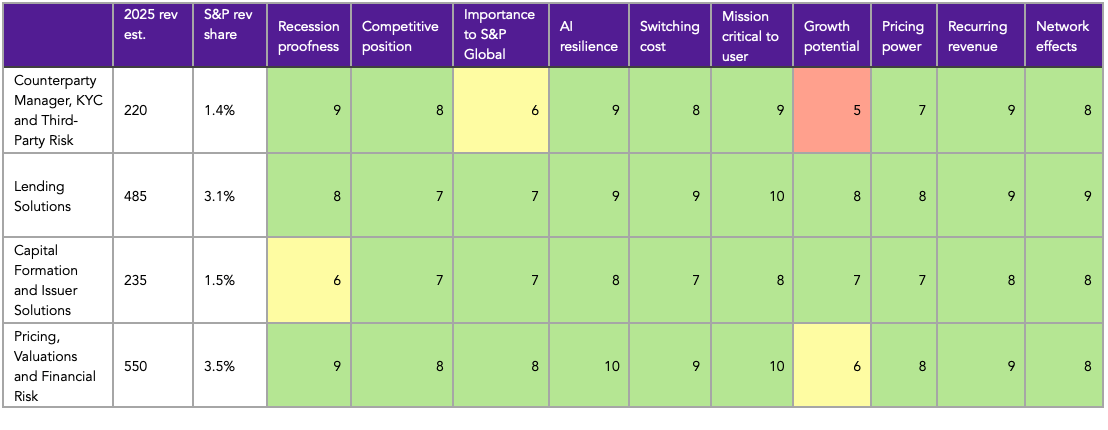
Unlike Kensho Data and Platforms, the majority of enterprise solutions tools weren’t direct products from S&P Global. Instead, most of these came from the acquisition of IHS Markit in 2022 and address solutions mainly targeted at mid-office functions at banks and asset managers. Most of these tools are even more mission-critical, proprietary and AI-proof than Kensho Data and Platforms. To better understand why, let’s look at one of the larger sub-product categories, Lending Solutions (26% of Jenga IP est. Enterprise Solutions revenue).
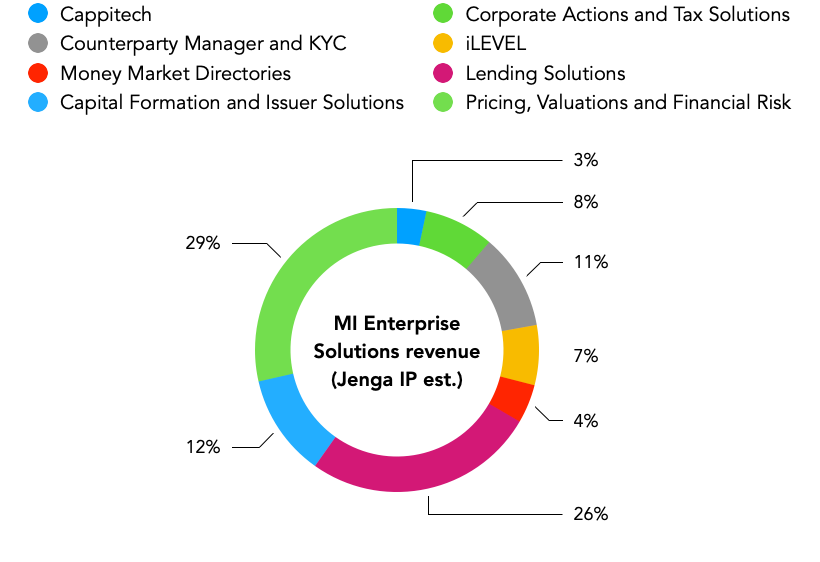
Lending Solutions
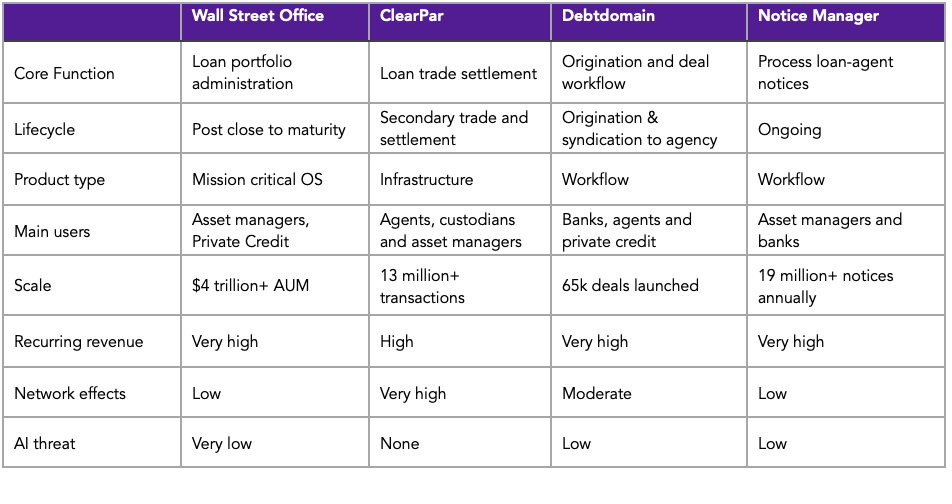
S&P Global’s Lending Solutions product catalogue is a combination of four IHS Markit legacy products that address the loan lifecycle for banks and asset managers, namely: ClearPar, Wall Street Office, Debt Domain and Notice Manager.

Loan transactions can be complex, often involving syndicates and other parties, with differing maturities and interest rates. Tracking the arrangements, accounting records, and cash payments requires maximum accuracy and is thus mission-critical for its users.
In the loan cycle, users start with Wall Street Office (WSO), where fund administration teams use its functions to ensure accurate P&Ls (WSO Reporting) and to produce reports and accounting entries (WSO Accounting). The market here is highly competitive, with solutions from Allvue and SS&C Technologies, and this is where ClearPar’s network effects come in for S&P Global.
Sellers (investment banks and dealers) and buyers (credit funds) then use ClearPar to coordinate loan trades from agreement through to settlement. By nature, the more counterparties on the platform, the more valuable ClearPar is for users. Some of these loans require syndicates (multiple lenders), and in these cases, DebtDomain provides a secure virtual room where its users can conduct due diligence, assess, and close the documents required for these syndicated loans.
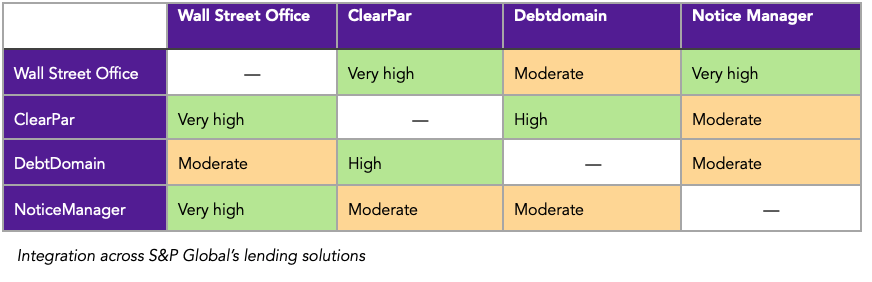
There are, of course, alternative tools such as SS&C Intralinks and LoanStreet that provide these capabilities, but S&P Global stands out for the integration across all four tools.
The table above outlines how I view the integrations across the lending solutions. Overall, as highlighted, they’re fairly strong. Supporting my view is S&P Global’s recently launched AmendX, which aims to fully integrate the loan amendment lifecycle, bringing the various platforms together.
As my product quality score suggests, S&P Global’s Lending Solutions perform well across all categories such as recession-proofness, AI resilience, high switching costs and being mission-critical for its users. At 40% of Market Intelligence revenue, the enterprise solutions bring more stability and resilience to technology forces and AI when compared to the Kensho Data and Platform products, albeit with slower growth.
Next, let’s move to the Energy division product analysis.
Energy (15% of S&P Global’s revenue)
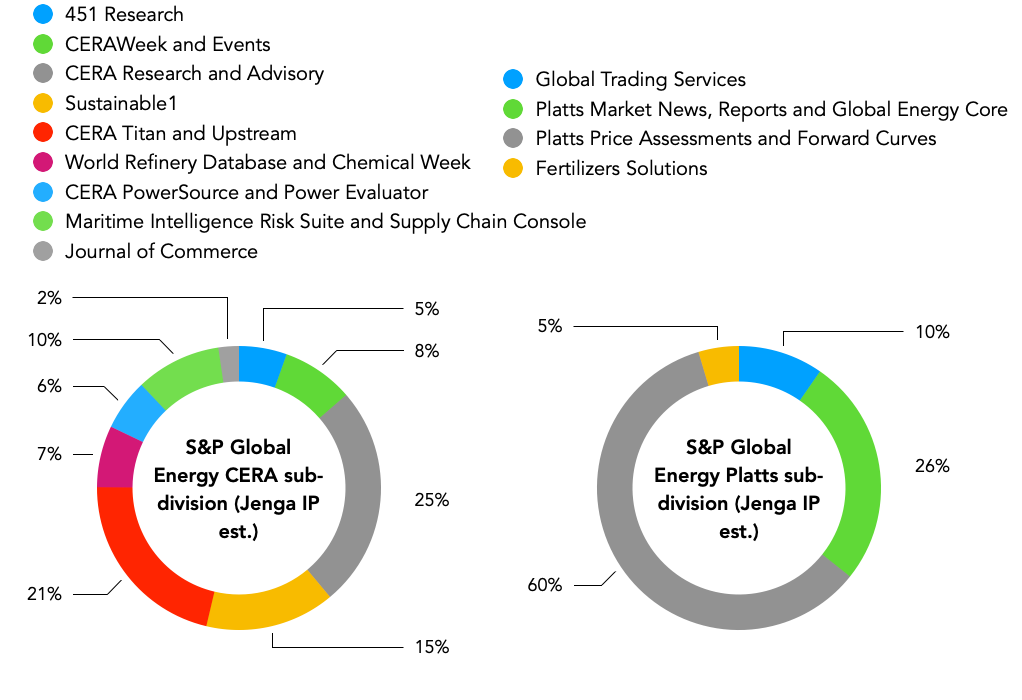
S&P Global’s energy division was built from a mix of legacy Platts market data and newsletters, CERA’s events and consulting from the IHS Markit acquisition in 2022 and some other bolt-on acquisitions like 451 Research and the recently acquired datacenterHawk. In line with management categorisation, we split the S&P Global Energy division into Platts (49% of energy division revenue) and CERA (51% of energy division revenue).
CERA (51% of S&P Global Energy division revenue)
The majority of CERA (Cambridge Energy Research Associates) comes from the IHS Markit acquisition. Prior to the IHS Markit merger in 2016, IHS acquired CERA in 2004. CERA was originally founded in 1983 by Daniel Yergin and James Rosenfield. As of today, CERA’s business model focuses on providing research and commentary on the oil and gas industry before broadening into power, geopolitics and energy overall. CERAWeek and its other energy events, which I estimate to generate approximately $105 million in annual revenue, started as a conference for CERA’s clients.
Today, CERAWeek has become one of the major industry conferences (ADIPEC is a rival) with over 12,000+ participants. Tickets range from $2,250 to $7,500 per person and, on its own, it is a profitable, sticky and high barrier to entry business. The more important revenue driver is the credibility the CERAWeek conferences provide for the CERA franchise, making its tools even more valuable and trusted by the energy industry players; CERA Titan was launched at CERAWeek.
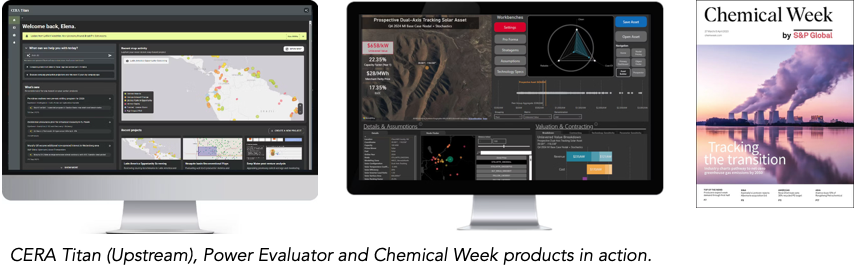
CERA Titan (Upstream) provides oil operators with data on 7 million+ oil wells, tracking changes and potential risks to support users’ decision-making. The research & advisory, which mainly competes with Wood Mackenzie, provides traditional ongoing consulting for energy operators and other participants, and we can view this as a typical industry-focused consulting business. Finally, adjacent to the non-CERA franchise but within the CERA sub-division, are products like World Refinery Database, Power Evaluator, and Chemical Week, that provide various subscription-based services to the broader energy, power and industrial customer base.
Of course, not all subscriptions are the same, and the energy industry itself is cyclical. During boom times, spending on these research tools and conferences increases, and it’s common for products across CERA Research & Advisory to experience some churn to peers like Wood Mackenzie, BloombergNEF and Rystad Energy. Another weakness, as highlighted in the table below, is network effects. CERA Titan, for example, doesn’t become more valuable as more users subscribe, and some of the one-off data points can be recreated with AI tools.
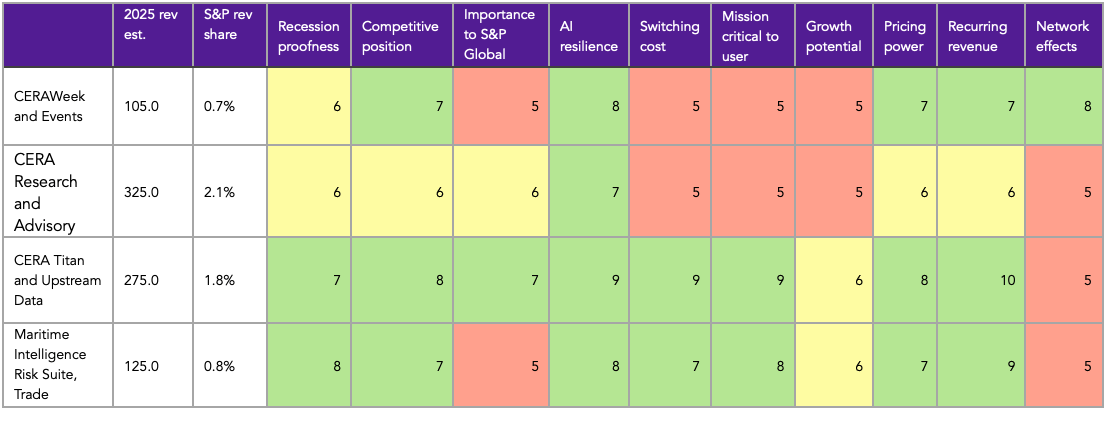
That said, in its own right, CERA’s products are incremental products with good margins, generating cash that can be reinvested into acquisitions or support the higher-margin Platts platform or other businesses.
Platts (49% of S&P Global’s Energy division)
Platts, which dates back to 1909 as National Petroleum News, was acquired by McGraw-Hill even before S&P in 1953, and is somewhat similar to S&P Indices with monetisation.
Central to Platts are commodities like crude oil (Platts Dated Brent and Platts Dubai), LNG (Platts JKM) and Iron ore (Platts IODEX), benchmarked by Platts, that establish the market prices that traders and other commodity participants use to trade and assess market prices. Excluding the royalty fees earned on derivative contracts through partners like ICE and, to a smaller extent, CME and the Singapore Index for Iron Ore, these benchmark prices aren’t directly monetised by S&P Global.
Note that royalty income is only 6% of the Energy division revenue. The real monetisation comes from subscriptions to commodity market participants for access to these commodity pricing data, and the integrated market reports, news feeds and analysis within the Platts ecosystem.
Although the underlying commodities are cyclical, Platts subscriptions are much stickier and can be delivered directly to desktops and via APIs and managed services. Even during downturns, commodity traders still want access to historical benchmark data and wouldn’t simply cancel subscriptions. Risk teams at trading companies constantly require forward curve data to manage volatility, making Platts an extremely valuable and “all-weather” franchise, as we will assess shortly with the S&P Ratings division.
The reinforcing dynamic between the benchmark data priced into each contract at ICE and CME makes Platts even more valuable to customers and creates network effects, which explains why I view the product (Platts Assessments and Forward Curves, see table below) as having a high pricing power score of 8 out of 10.
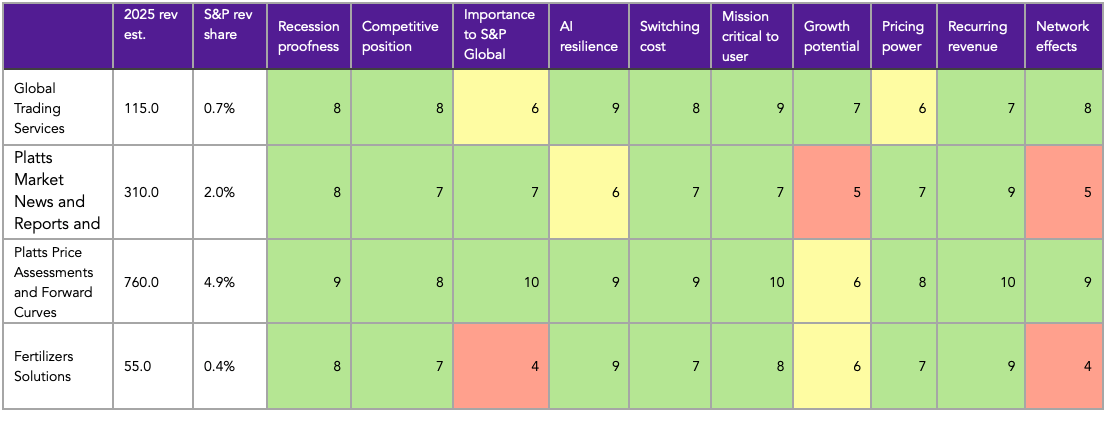
Compared to CERA and the two divisions within Market Intelligence, I believe Platts is the highest quality product of the four and is one of S&P’s four cash cow divisions with 50%+ EBIT margins.
Next, let’s move to the next division that has two of these cash cow divisions: Ratings.
Ratings (30% of S&P Global’s revenue)
Ratings is S&P Global’s most important segment, accounting for 45% of total operating profits. It’s also one of the most lucrative businesses, with EBIT margins of 60%+, second only to the Indices business. As we’ll explore further in the business economics (section 6) and industry analysis (section 4), there are structural reasons for its profitability - high barriers to entry, network effects, and mission-critical status for users and markets, among others.
First, let’s discuss what credit ratings are.
There are two sides to the ratings business from a product lens. When a corporation or government issues debt, debt investors seek a qualified opinion on the issuer’s ability to meet the loan obligations. S&P, like Moody’s, Fitch, and other credit rating agencies, employ a scale (see table below) to score and rank the issuer’s ability to meet the obligations.
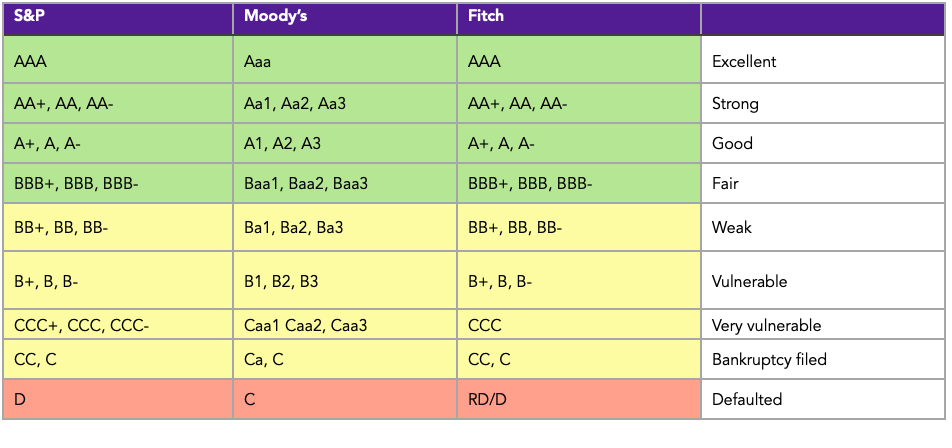
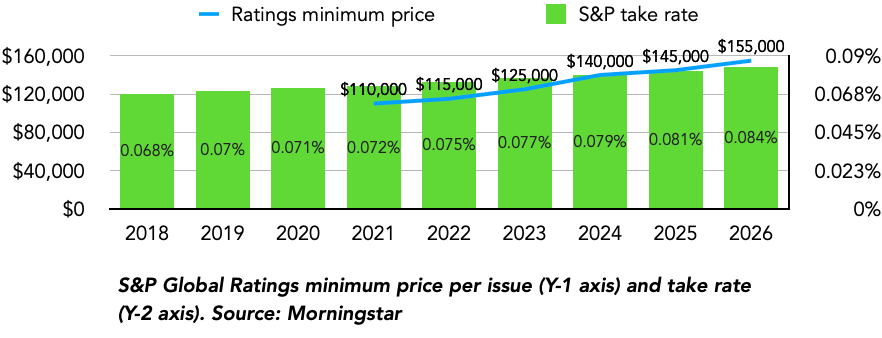
On average, the initial rating service costs the higher of $155,000 or 0.0835% of the debt volume, and is paid by the issuer. These one-off initiation ratings account for 40-55% of total ratings revenue, depending on issuance volume, which is highly cyclical, particularly for products such as structured finance ratings. The more lucrative and recurring part of the product catalogue is the surveillance services provided after the initial issuance. S&P Global charges its customers annually for frequent monitoring and updates on the issuer’s financial health.
Investors and market participants, in turn, use the information produced in the credit ratings analysis to support their investment decisions; assess and calculate risk, allocate portfolios, manage collateral and regulatory capital, among other uses.
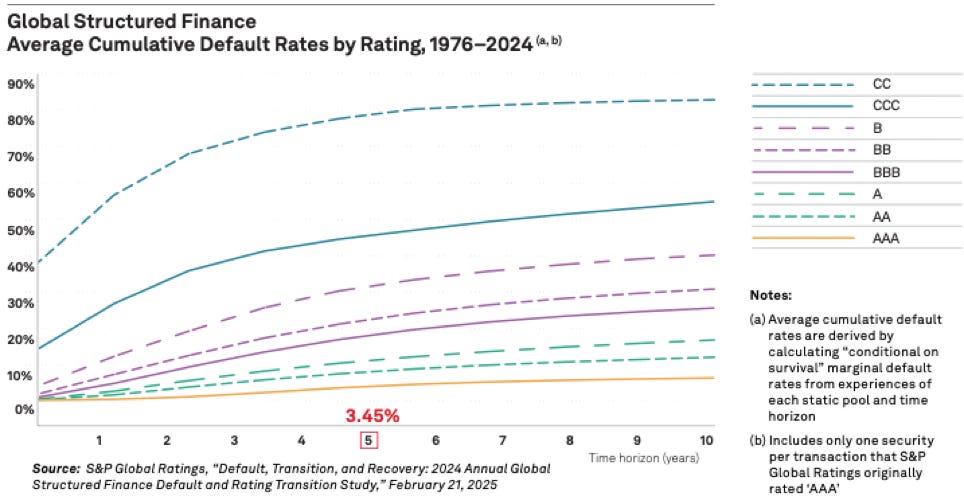
As highlighted in the chart below, S&P Global’s historical ratings have been a fairly good indicator of default rates. Over the last 50 years, there’s a direct correlation between default rates and S&P’s ratings ranking.
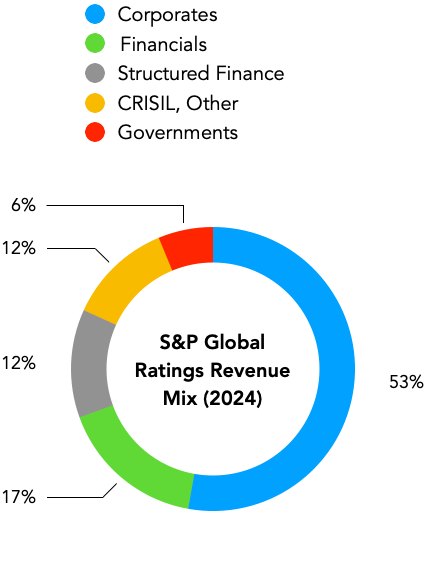
There are two ways we can break down Ratings by products: S&P’s official revenue mix chart (top), which splits Ratings into five segments and then my own estimate (bottom), further splitting Ratings into 12 products.
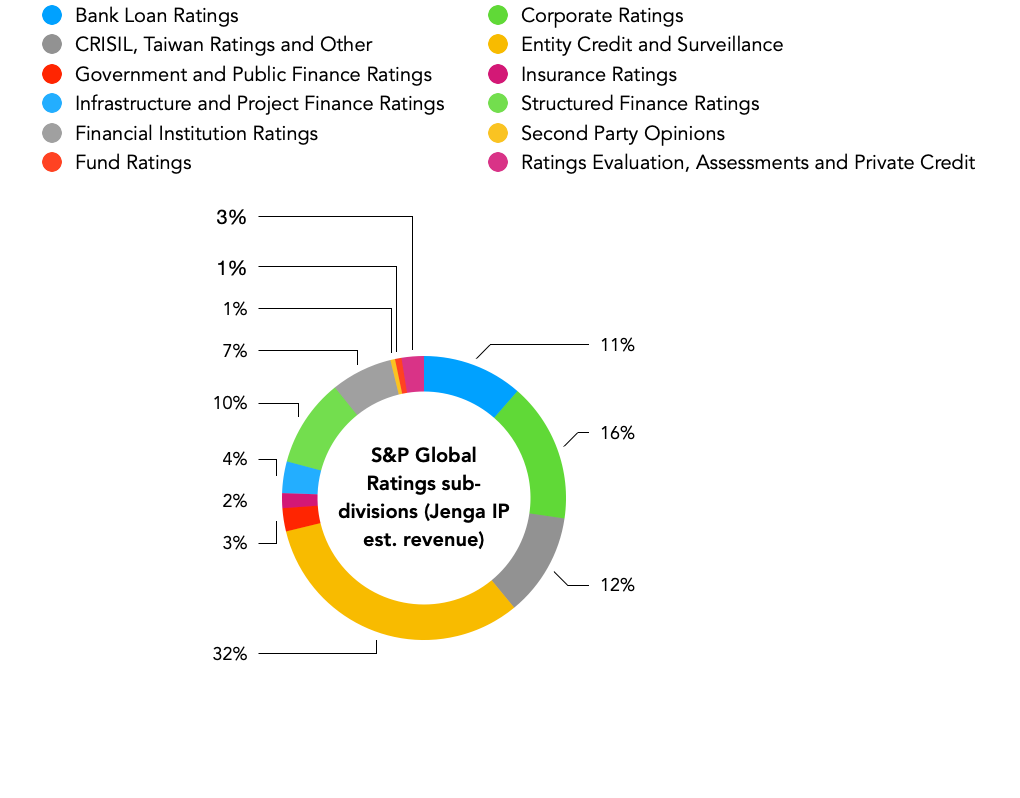
Given that corporate ratings are the largest product division within the transaction (initial ratings fee) revenue type, let’s further explore this.
Corporate Ratings (excludes surveillance, 16% of Ratings revenue)
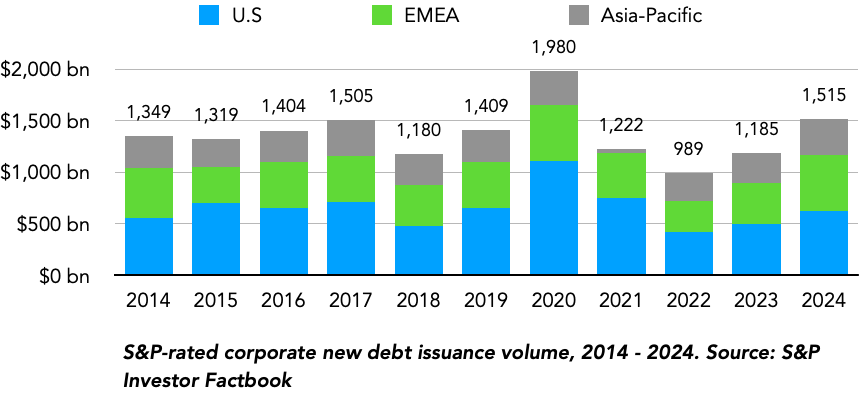
The chart above highlights the global volume of corporate debt issuance, excluding financial services, rated by S&P Global between 2015 and 2024. In 2024, it represented 29% of all S&P-rated new issuance, having grown by just 1.4% annually. As you can see in the chart, new issuance volumes are quite cyclical and highly driven by interest rates, macro stability, M&A, and Capex activity needs across companies.
S&P’s volume share varies around the world. In the U.S., S&P covers 99% of all rated debt volume, but in countries such as Japan and China, domestic peers such as JCR and others have a larger share, with S&P more concentrated in issuers targeting international investors.
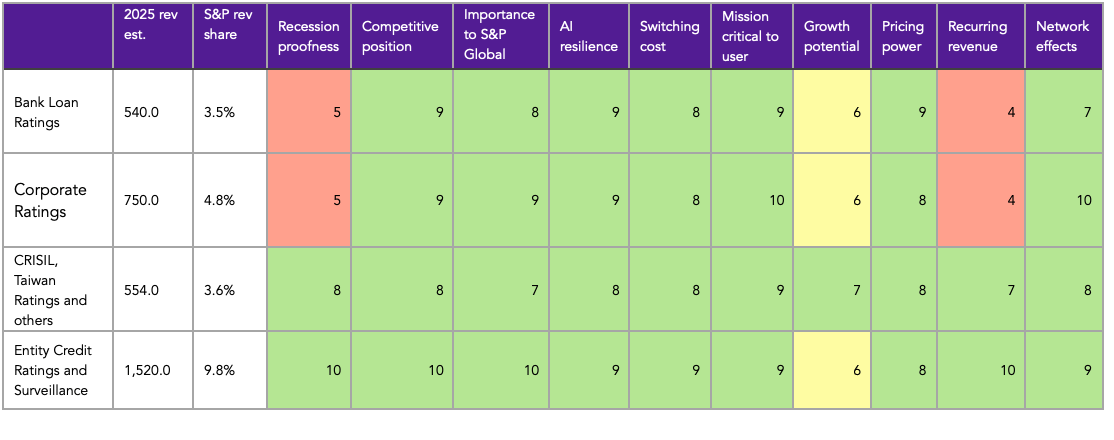
As highlighted in the Jenga IP product ranking table above, while corporate ratings score highly on key metrics like AI resilience, mission-critical, and competitive position, the inherent cyclicality and one-time nature of its service lead to poor scores in recurring revenue and recession-proofness. Surveillance, on the other hand, doesn’t have these shortcomings, leading to a materially better product than the initial corporate rating.
S&P currently owns a 66.6% stake in India’s first and largest credit rating agency, CRISIL, and I will discuss it more in the CRISIL valuation (section 10).
Indices (12% of S&P Global’s revenue)
Like Ratings, S&P Global’s Indices division is a “standards business” and provides mission-critical services to several stakeholders. While there are different products here, at their core, the business model is quite similar. S&P calculates and benchmarks the performance of various markets and then provides that data to users, including exchanges such as Cboe (SPX options and VIX), CME Group (owns 27% of S&P Dow Jones Indices LLC, S&P 500 E-mini), and Australia’s ASX (co-branded Australian stock indexes), among others. Large American active funds benchmark their strategies to the S&P 500 and pay S&P Global a fee, typically based on the fund’s AUM.
The most important customers for the Indices business, though, are Exchange-Traded Funds (ETFs) and passive funds, led by the big three: BlackRock, Vanguard and State Street. These companies benchmark over $4.3 trillion in assets to S&P Indices products and, in return, S&P receives a license fee, estimated at roughly 0.01-0.03% of the underlying assets, plus an annual license fee, estimated at $600,000 for some funds.
S&P Global Indices can be segmented by products in several ways, and I employ an Indices family approach to achieve this.
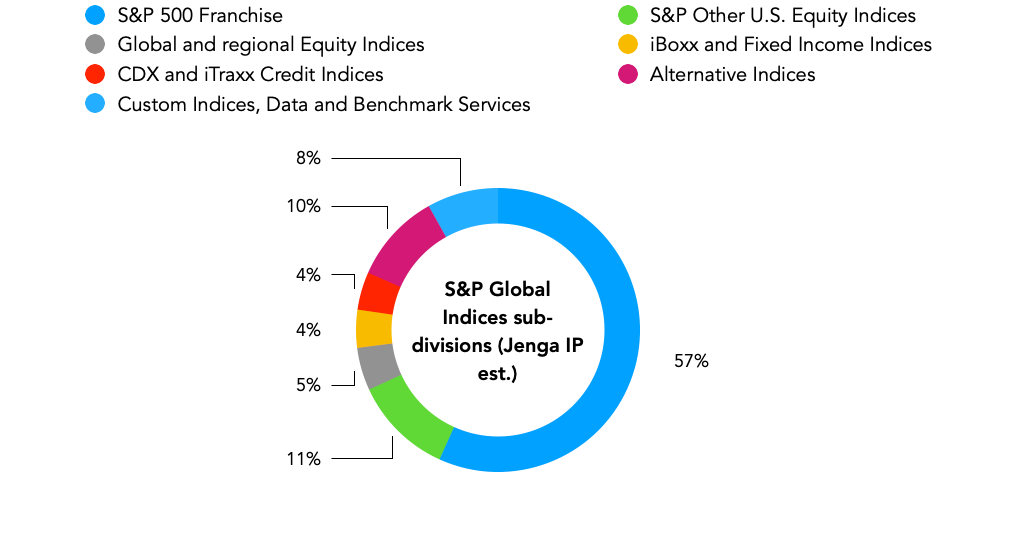
As shown in the chart above, the Indices division is split into 7 product families, with the S&P 500 Franchise family representing the largest share, at roughly 57% of revenue based on my estimates.
S&P 500 Franchise Family (57% of S&P Global Indices revenue est.)
Investors in passive and active funds require a widely accepted and trusted benchmark representing the U.S. stock market, and the S&P 500 is the market leader with $13 trillion in indexed (ETPs, non-ETPs, and ETDs) assets and $7.1 trillion in benchmarked assets.
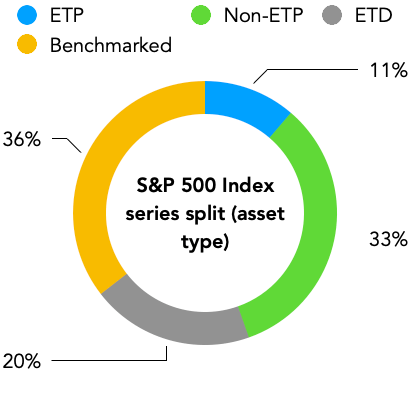
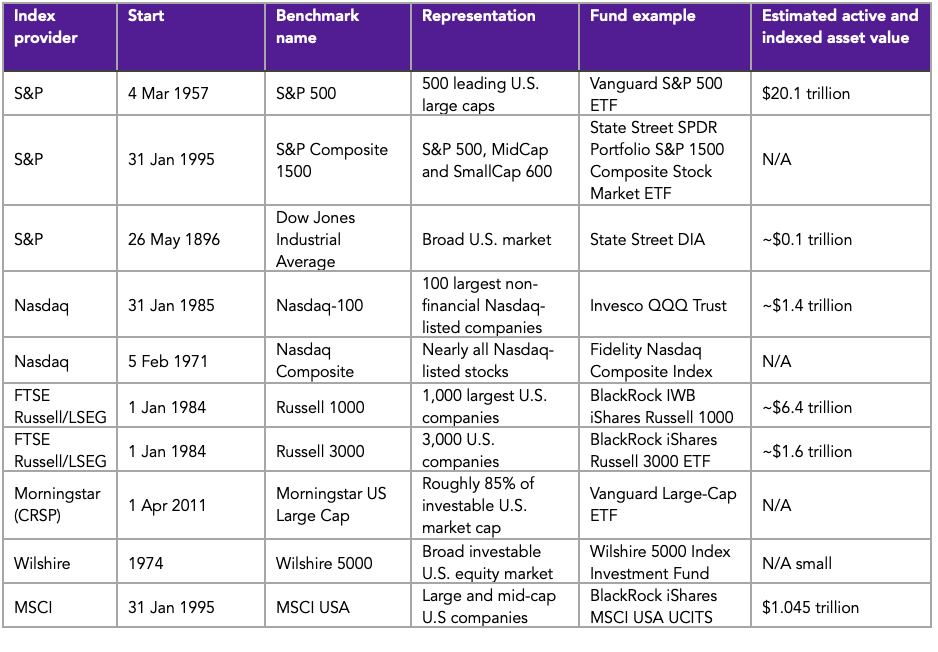
The table above highlights 9 alternatives to the S&P 500 for U.S. markets, and as you can see, the S&P 500’s asset value is greater than the other 9 benchmarks combined. Despite having several alternative benchmarks, a question one might have is why the S&P 500 remained so relevant to markets.
Indices are the prime example of where the first mover has a real advantage. Excluding the Dow Jones Industrial Average (DJIA) index, the S&P 500 arrived first, and compared to the DJIA, its more accurate market-cap weighting and larger number of companies covered ~500 versus 30 in the DJIA made it a more accurate reflection of the U.S. equity markets.
Over time, it becomes a self-reinforcing flywheel. The more funds and newspapers quote the S&P 500, the more valuable it becomes as a benchmark. The 69 years of S&P 500 data also give it a time edge over peers such as MSCI USA or Russell 1000. The brand also builds up over time, and today S&P is almost synonymous with U.S. markets. Of course, this is a disadvantage and explains why S&P’s international indices failed to take much share from MSCI in the international market.
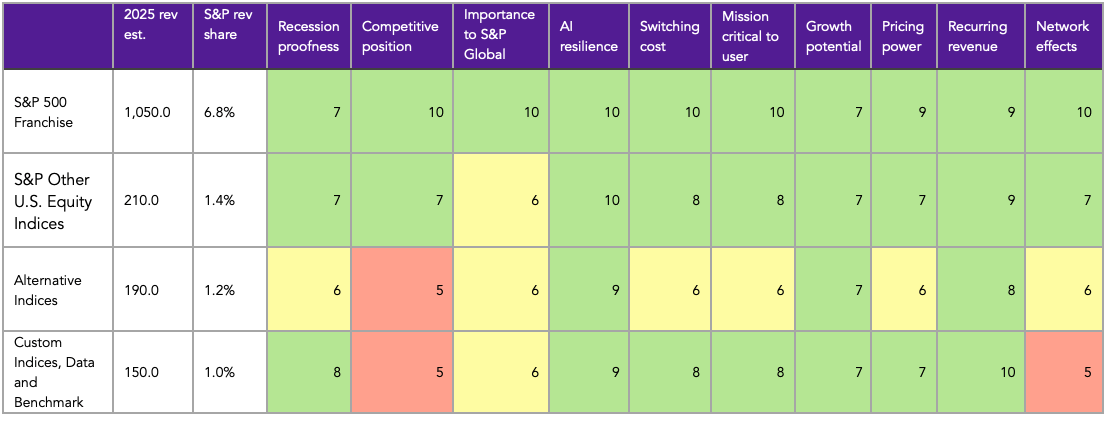
I estimate that the S&P 500 index alone generates over $1 billion in asset-linked revenue and is one of the largest and most important products across S&P Global. As shown in the Jenga IP Product table below, it has favourable scores across all categories: little to no AI risk, extremely high switching costs given the decades of data, and entrenchment in asset allocation, risk analysis and performance measurement for many funds.
Mobility Global (11% of S&P Global’s revenue)
The recent spinoff of S&P Global’s former Global Mobility division, now called Mobility Global, in July earlier this year adds a little complexity to the S&P Global investment analysis. For completeness and comparison, I will explore the investment case and valuation model for Mobility Global in section 11, but for now, let’s first introduce the products, what they do, whom they serve and how competitive they are.
As an overview, Mobility Global’s heritage comes from IHS Markit’s transportation division, whose own heritage was IHS before the IHS Markit merger. Today, Mobility Global is broadly split into categories: dealer subscriptions, which cover four Carfax products; data analytics, covering B2B marketing and sales; and strategy and planning.
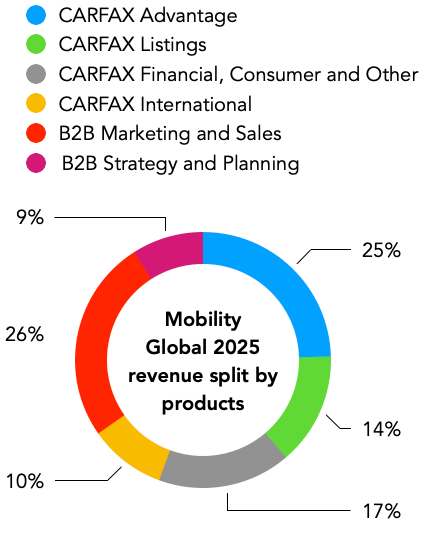
The six sub-divisions by products are mapped out in the charts below, and as you can see, it’s approximately 65% Carfax and 35% B2B tools. Let’s further dive into both of these.
Carfax division (65% of Mobility Global revenue)
Since its founding in 1984, Carfax has helped American and, more recently, European second-hand car buyers shop more effectively with more detailed and accurate information on a car’s history. Whenever a car visits a repair shop, is involved in an accident, or changes hands, the data is recorded in several databases, and Carfax brings all the datasets, including its own proprietary data, into one vehicle report. While the benefits largely accrue to buyers, Carfax generates income from car dealers (Carfax Advantage) because providing these reports to potential buyers helps close car purchases for dealers.
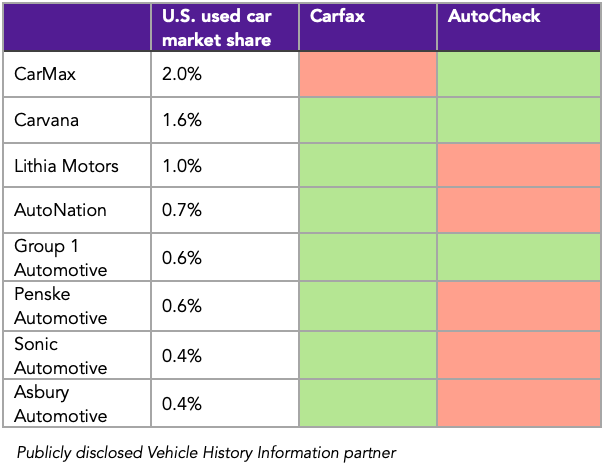
Car dealers sometimes purchase from both main providers, Carfax and Experian AutoCheck, but it’s far more common for dealers to select only one. The table below highlights the market share and the product used among the top 8 listed U.S. car dealers. As shown, CarMax, the market leader, is the only dealer that doesn’t use Carfax.
Carfax Car Listings (launched in 2014) and For Life (launched in 2019) are two diversification activities Carfax is currently scaling to further support dealers. Listings helps connect buyers with dealerships, and its main differentiator over peers is that it includes a free Carfax vehicle history report, giving buyers more data. Compared to CarGurus, though, Carfax still has less price comparison and inventory breadth, and when compared to Autotrader and Cars.com, Carfax is behind both in new car options.
B2B Solutions (35% of Mobility Global revenue)
For simplicity, one can view the B2B Solutions as the legacy non-Carfax IHS Markit automotive products, such as Polk (OEMs), automotiveMastermind (dealers) and the later acquisition, Market Scan (dealers). These products target a diversified range of customers, but at their core, they all fall into either helping customers plan and forecast better or sell and market better.
While Mobility Global doesn’t disclose which of these three is the largest in revenue, analysis of each suggests Polk Automotive is likely the largest due to its more diversified touchpoints. An OEM like Toyota could use Polk Audiences to learn its target audience better and improve its advertising strategy. Polk Data Services acts more as a CRM dealer for dealers and helps verify and clean up customer databases.
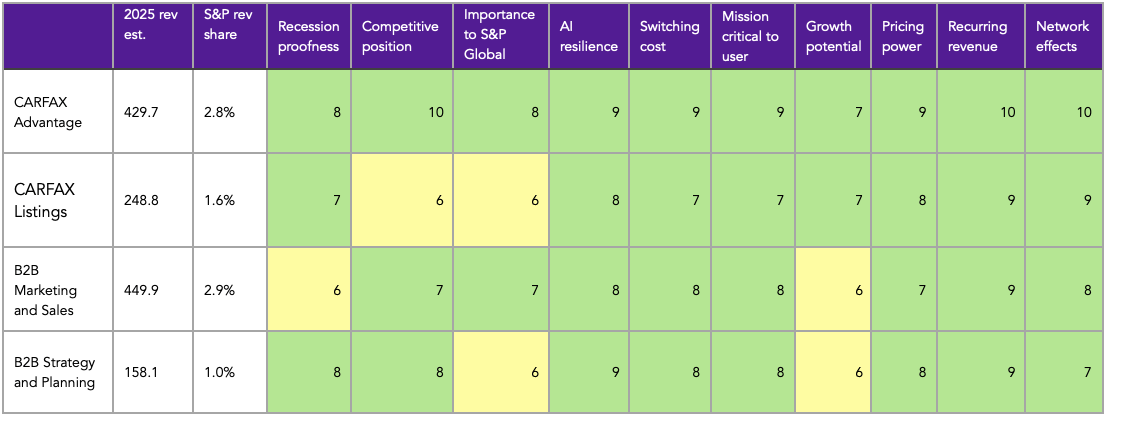
Both Carfax and B2B Solutions lean more toward subscriptions than one-off transactions, but B2B Solutions is slightly more tilted toward the cyclical auto sector. The slower growth at B2B Solutions, given these are more mature offerings, limits the growth potential, as shown in the table below.
S&P Global’s product portfolio: Concluding thoughts
The most important insight from the review and analysis of S&P Global’s 54 product families is that their diversified, mission-critical, and benchmark positions protect S&P Global from AI disruptions and competition. The Ratings and Indices products are certainly more resilient when compared to Energy and Market Intelligence, but as we explored, even in the latter, S&P Global still has strong competitive positions.
The conviction gained from analysing its products gives me confidence in where I see S&P Global’s overall quality, and building on this quality analysis, I will next analyse the respective industries relevant to S&P Global.
3. The Credit Rating and Index Industry
Objective: To understand the credit ratings and the index industries better, map out S&P Global’s competitive position relative to peers, and explore the respective industry cycles. Introduce CRISIL and the Indian Ratings industry.
Credit Ratings
Globally, there’s roughly $28 trillion in fixed income issued debt, and the ratings industry’s goal is to provide an analytical and unbiased view on the likelihood of the issuer’s ability to pay lenders. Of the $28 trillion in fixed income issuance, roughly 22% (fluctuating between 16% and 25%) is rated by the credit rating companies because some debt, such as private loans and placements, confidential private borrowings and some investor bases, don’t require them.
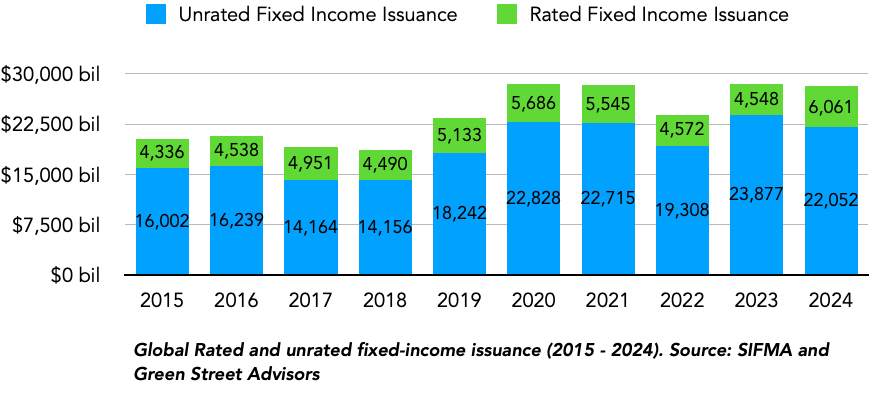
Across the $6 trillion of rated debt in 2024, S&P Global rated 90.6% ($5.5 trillion) and to understand the makeup of the industry, it’s helpful to examine the industry from two lenses: by security and product and then discuss how credit rating agencies monetise their ratings.
Ratings by security (Corporate, Sovereign and Structured Finance)
There are three key ratings categories by security type, and the largest of the three is corporate ratings, which typically represents 50-60% of the market in most years, mainly dependent on how cyclical the structured finance ratings are. Corporate ratings are also the most dominated and penetrated by the big three ratings agencies (S&P Global, Moody’s and Fitch). S&P Global, for example, rates 99% of the U.S. non-financial corporate debt and 100% of the corporate infrastructure debt market. Investors of corporate-rated debt generally demand names they recognise, and issuers follow these expectations, leading to most seeking rating opinions from Moody’s and S&P Global.
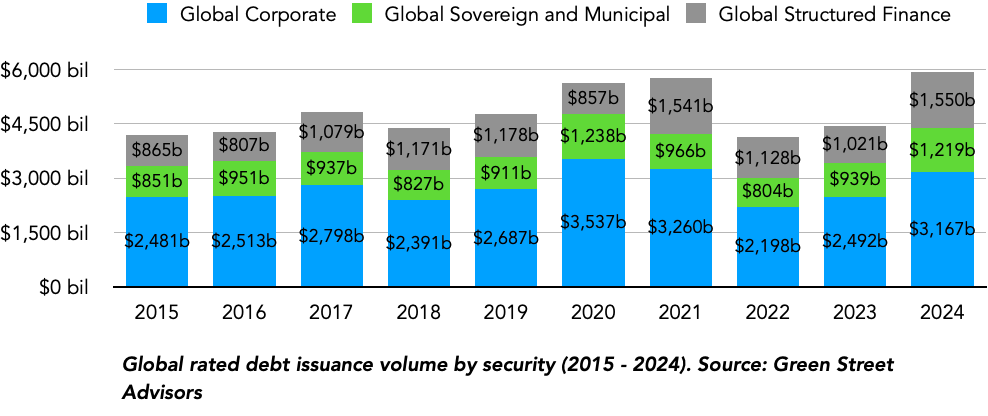
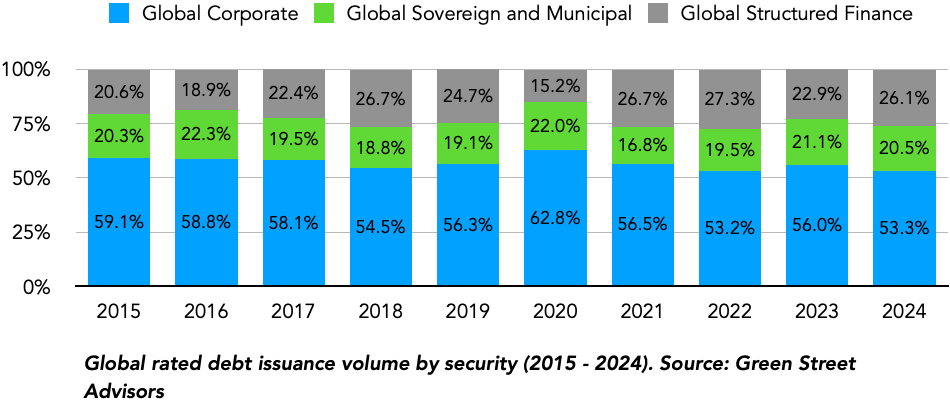
Unlike corporate ratings, structured finance (26% of 2024 issued ratings) has significantly more competition, and this is both structural and due to the big two (S&P Global and Moody’s) role in the financial crisis. The subsequent losses accumulated by structured finance investors left a permanent distaste, and the industry sought to diversify away from them, with Morningstar’s DBRS and Kroll Bond Rating Agency taking up some share in the market. Structured finance also has more niche sub-products, with specialist participants, thus lowering the barrier to entry within structured finance as well.
To highlight how severe the share loss has been post-financial crisis, the chart below maps the U.S. Asset-Backed Securities Ratings market by share of ratings covered across the big four companies (see chart below).
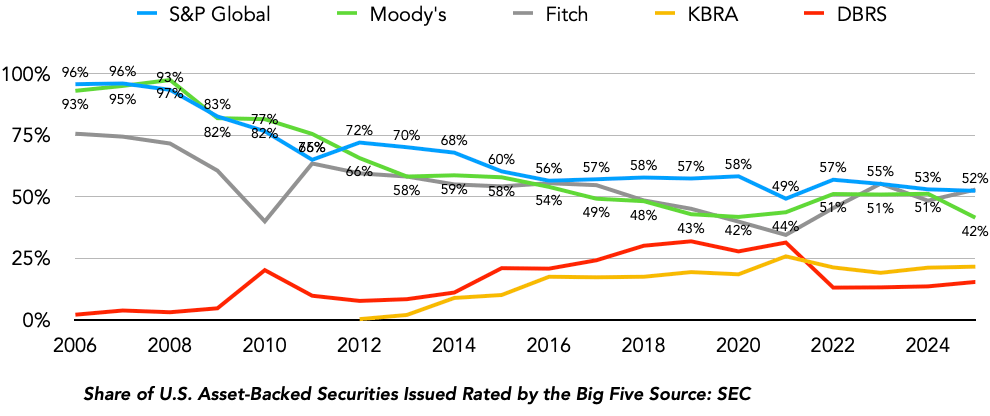
As highlighted, S&P Global’s share has steadily fallen from 96% to 52% in 19 years, while DBRS has seen its share grow from 2% to 15% between 2006 and 2025.
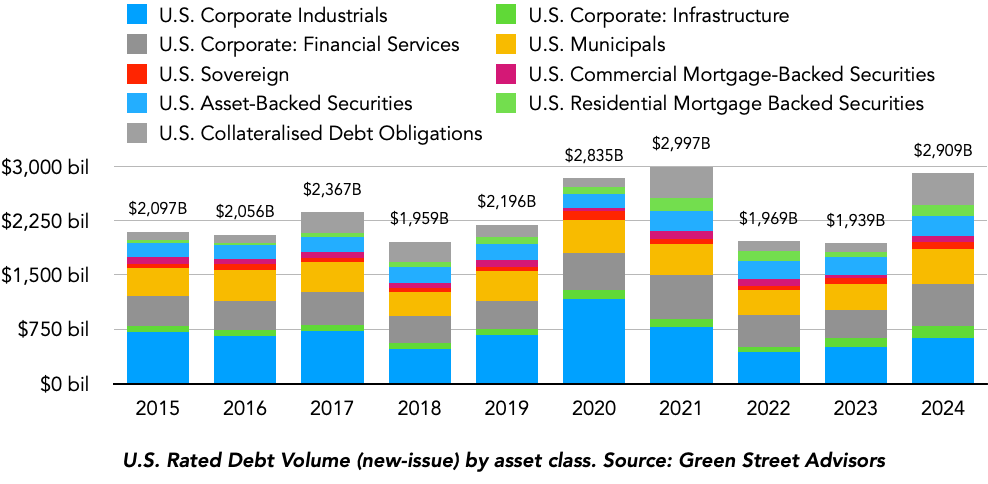
It’s also worth highlighting the sub-products within each security type, and the chart below highlights the current breakdown into 9 sub-categories in the U.S., led by corporate industrials, with U.S. sovereign being the smallest.
Ratings by geography (U.S., EMEA and Asia-Pacific)
Since their expansion into rating British sovereign debt in the 1970s, setting up offices in the U.K. and Japan in 1984 to 1986, the credit ratings big three have steadily expanded globally, entering markets via multiple channels such as local acquisitions in existing players Taiwan Ratings (Taiwan), CRISIL (India), Agusto & Co (Nigeria), and direct incorporations as in France (1988), Germany (1991) and Spain (1992).
The 48 years of expansion have certainly paid off, and today, 52% of the addressable market comes from outside the U.S., and the chart below highlights the breakdown among the U.S., EMEA and Asia-Pacific.
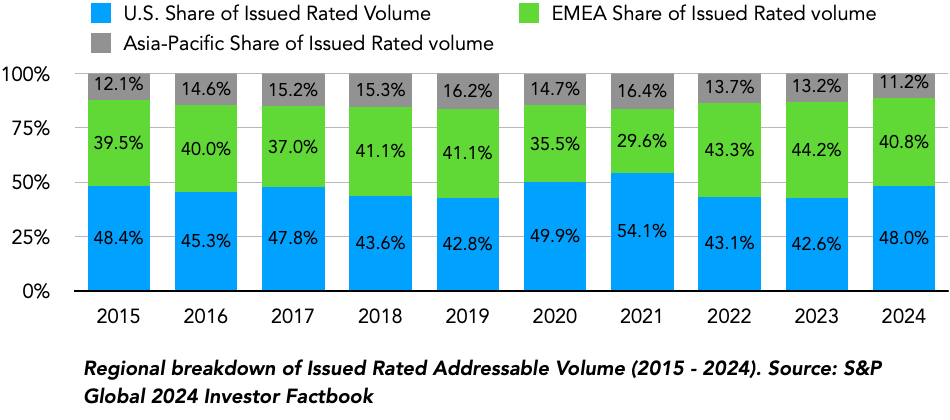
As evident in the chart, the Asia-Pacific region has a disproportionately low share when compared to its GDP. Although Asian countries were more strict in mandating credit ratings across fixed income markets, several of these countries prioritised local players and ensured limits to full takeovers by international companies like S&P Global. Today, countries like Japan, South Korea, China and the Southeast Asian countries are dominated by domestic players, and the big three’s participation is broadly limited to minority stakes in domestic companies.
Europe and the U.K. regulators publish annual market share data for their respective credit rating markets, and assessing this data reveals more information on just how oligopolistic credit rating is (see chart below).
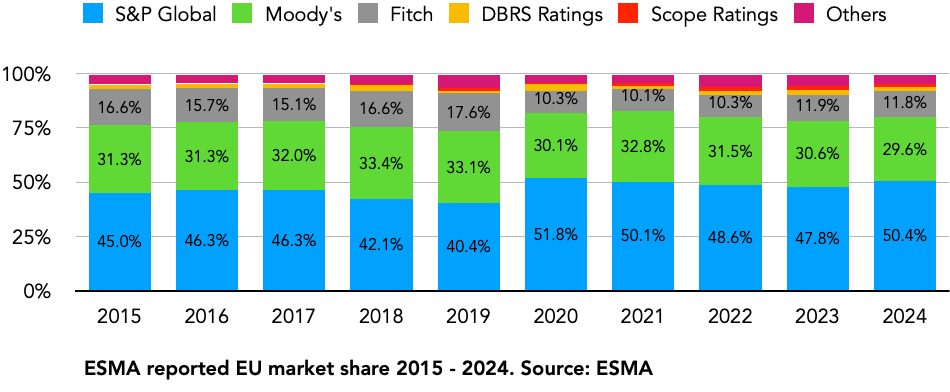
Despite the growth of tier 2 companies in structured finance and sovereign ratings, more than 90% of the European credit rating industry is dominated by the big three and over the last 10 years, as shown, S&P Global held steady, increasing its share from 45% to 50%, reconfirming a core part of our investment thesis: high barriers to entry and market share dominance.
Ratings Industry - Revenue perspective
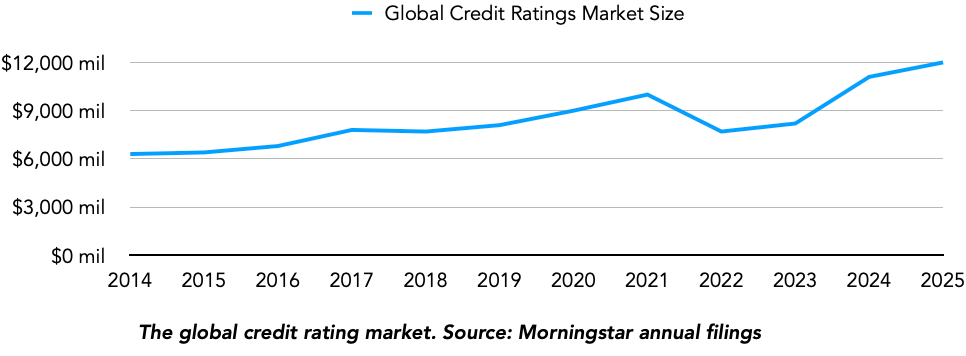
Publicly available data on the credit ratings industry global market size is surprisingly scarce, but through data published in Morningstar’s AGM, we can conclude the industry achieved $12 billion in revenue in 2025, growing by 5.9% and 6.5% in the respective 5- and 10-year trailing periods.
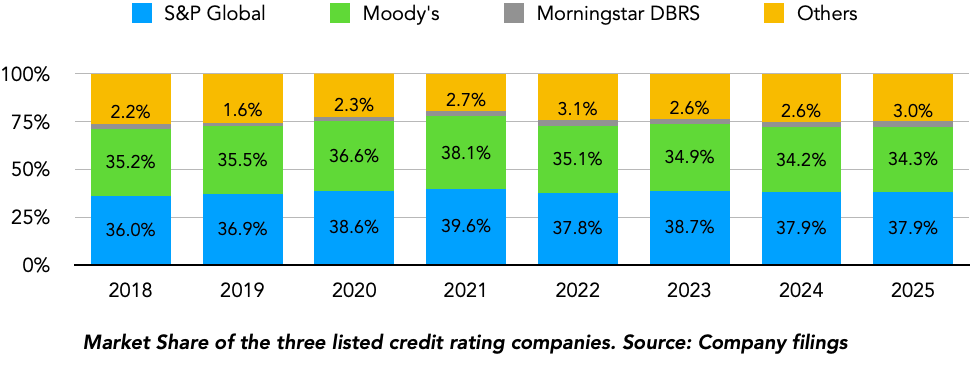
Using the market share data above, one can conclude the share held by S&P Global, Moody’s and DBRS, and the table above highlights the global market share held by the three companies between 2018 and 2025.
In the business economics analysis section 6, we will discuss more about the economics of S&P Global’s ratings, diving more into the non-transaction revenue model and how S&P Global has pulled away from Moody’s in the recurring aspects of ratings.
The index industry
The index industry is S&P Global’s second most important industry when we consider its operating profits and, in my view, is just behind ratings when we think of attractive industries in which to be a dominant player. Compared to ratings, the index industry has showcased superior growth in recent years, growing by 13% over the past 8 years (see chart below).
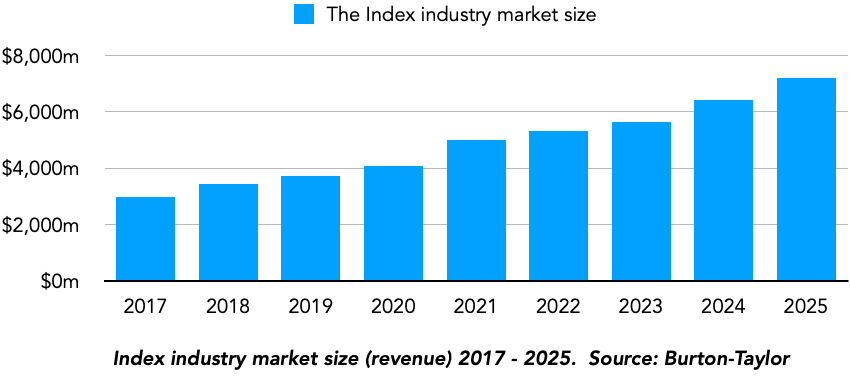
Central to the index industry’s growth is the rise of Exchange-Traded Funds (ETFs), pooled investment funds holding a basket of underlying assets (launched in 1993). For users such as pension funds, asset managers and institutional investors, ETFs reduce the cost of investing when compared to alternative vehicles such as mutual funds. Beyond costs, factors such as ease of access, diversification and tax efficiency also contribute to ETF assets’ gains when compared to actively managed mutual funds.
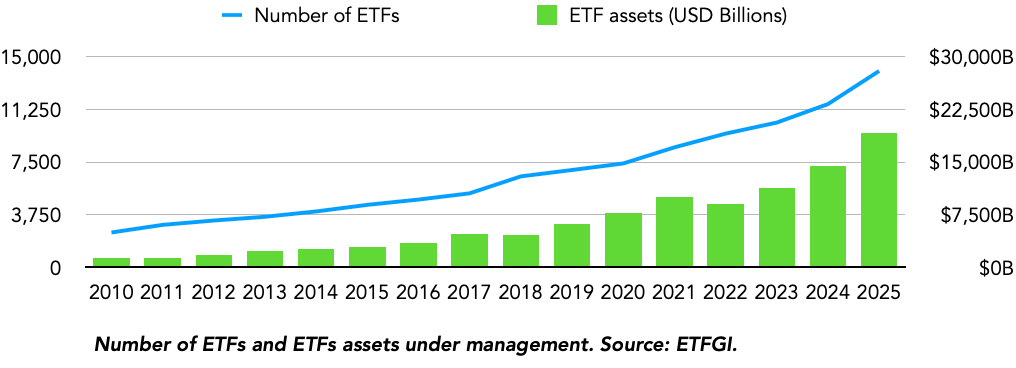
As shown in the chart above, the number of ETFs and ETF assets under management (AUM) have both trended upwards, compounding annually by 12.2% and 19.5%, respectively. There are three main ways the industry monetises the ETF and indexing boom, which brings us to revenue by fee type: subscriptions, asset-linked revenue and others.
While all three are important for S&P Global, as we will discuss in section 6 (business economics), asset-linked revenue, which is currently 52% of the industry’s revenue (see chart below), is 65% of S&P Global’s Indices revenue.
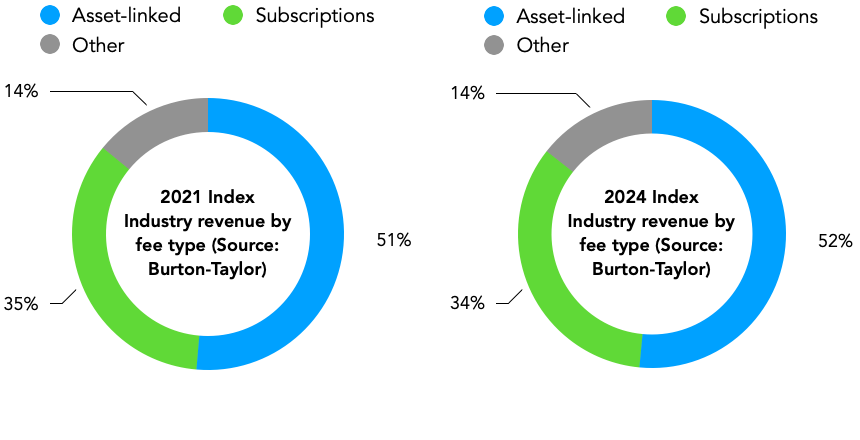
Compared to the two other major players in the index industry, FTSE Russell (38% of its revenue) and MSCI (41% of its revenue), S&P Global’s skewness towards asset-linked revenue is primarily due to the S&P 500, the world’s most widely used index benchmark. As at the end of 2024, $13 trillion (or 78% of S&P Indices indexed assets) was linked to the S&P 500, and S&P Global primarily monetises this by charging ETF providers like BlackRock, Vanguard and State Street license fees.
Less indexed benchmarks like the U.S. Russell family of benchmarks, MSCI ACWI and World and the S&P custom and thematic indexes are sold to asset managers as subscriptions, and in return, asset managers receive index constituent data, index values and access to historical changes.
During market drawdowns, subscription revenue holds up better than asset-linked revenue, given the revenue weighting towards fixed prices rather than prices based on market performance, and I will discuss how this dynamic impacts my revenue estimates for the future in the business economics analysis (section 6).
Let’s next review how the industry is divided by product category.
The Index industry by product category
Unlike credit ratings, the index industry is more influenced by equity markets, and as shown in the chart below breaking down the industry by product category, traditional equity products represent 66.9% of the index industry’s revenue in 2024, down from 69.9% in 2017, with the decline primarily driven by the increasing drive for factor indexes by quantitative funds (9.2% to 12.6% share).
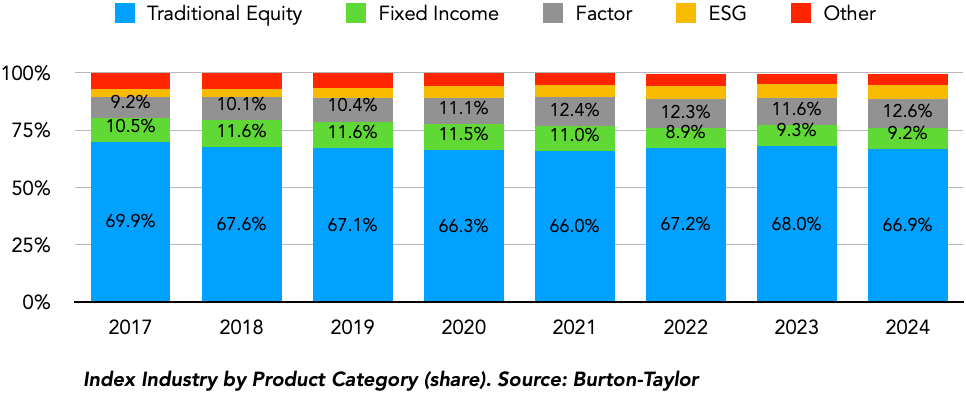
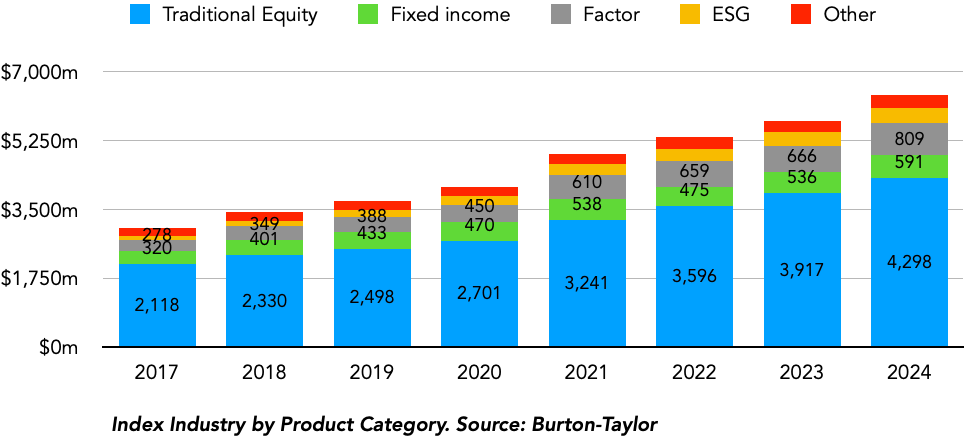
The revenue by product category highlights an important issue and drawback of the index industry: its exposure to market performance. Although revenue has broadly trended upwards over the past decade, the pace of growth largely depends on the performance of the underlying benchmarks. For example, in 2024, Nasdaq, supported by the tech- and growth-heavy Nasdaq 100, grew its revenue by 33%, well above the major three index providers.
The important takeaway here is that we can’t simply extrapolate past performance for coming years and must take a conservative approach to forecasting the underlying asset growth, as well as growth driven by new flows.
This brings us to the makeup of the index industry, and as shown on the two charts below, the index industry is dominated by three companies: S&P Global, MSCI and LSEG. In recent years, MSCI and S&P Global have exchanged the market leadership position. S&P Global’s skewness towards asset-linked revenue, when compared to MSCI’s more subscription-based revenue, helped it regain industry leadership as equity markets rose post-2023.
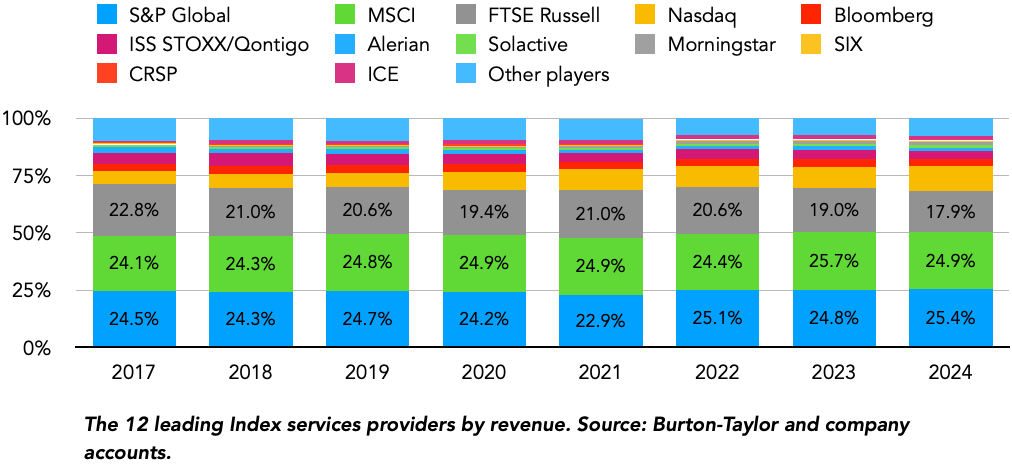
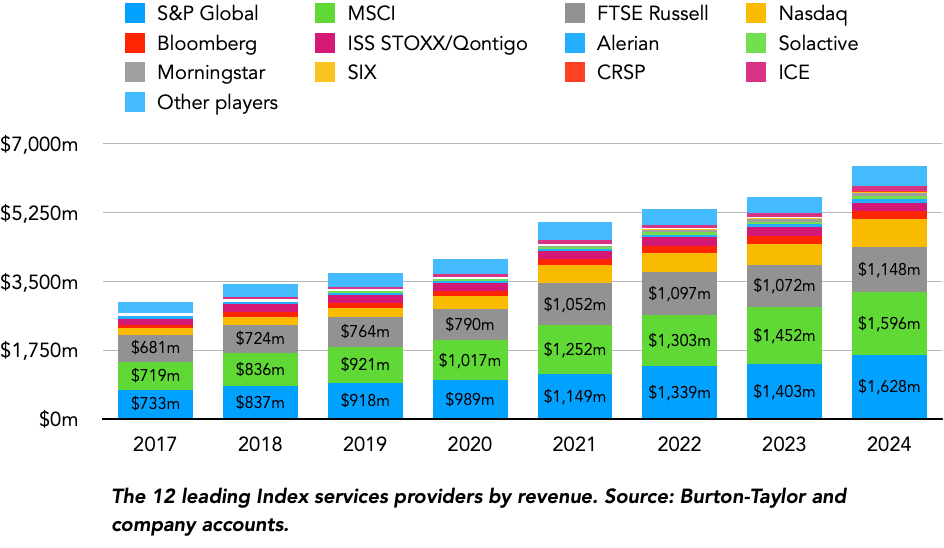
Compared to credit ratings, the index industry is less oligopolistic; the top three credit rating companies hold approximately a 92% share, compared to the index industry’s 68% share held by the largest three. While a few reasons drive the more competitive market structure, the most important are customer concentration and more limited switching costs.
The index industry, as discussed earlier, is heavily driven by the rise of ETFs, which in turn is oligopolistic, with approximately two-thirds of ETF assets held by the major three providers: BlackRock, Vanguard and State Street. The result of the customer concentratio means that the index providers have much less value chain control when compared with credit rating providers, and there are a few examples of this weakened position in action. In 2012, Vanguard flagged its goal of reducing licence costs for benchmarks and switched 22 ETFs from MSCI’s indices to FTSE Russell and CRSP. Solactive’s lower-cost pricing model enticed TD Asset Management to switch from previously benchmarked S&P ETFs to Solactive Indexes.
The resulting impact of the index industry’s more competitive market structure is its more limited pricing power, evident in S&P Global’s asset monetisation (asset-linked revenue as a share of average indices AUM), as shown in the chart below; it declined by 42% between 2016 and 2025, from 4.4 basis points to 2.5 basis points.
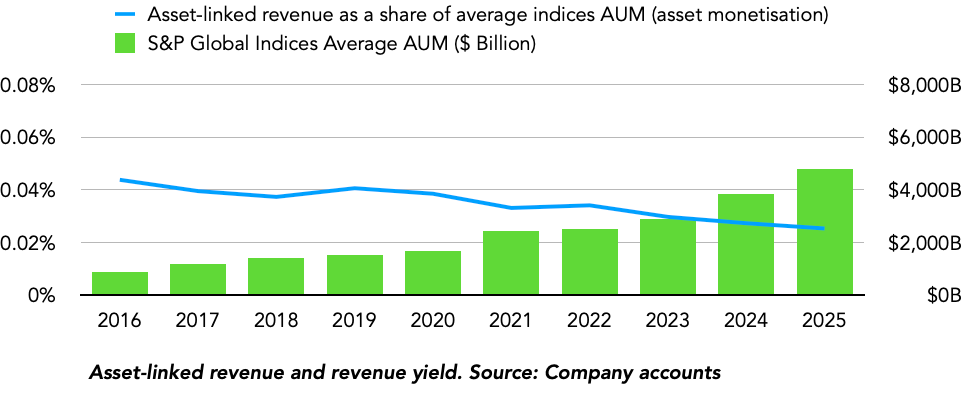
We expect this trend to continue for the foreseeable future and map out how it impacts the index revenue growth estimates in our growth analysis (section 7).
The Indian credit rating industry
S&P Global’s direct involvement in India’s credit rating industry through its 66.6% holding of CRISIL means analysis of India’s credit rating industry deserves its own section. Rather than rehashing a full top-down analysis of India’s industry, I’ll focus on discussing four key differences between India’s industry and the global credit rating industry as discussed earlier.
Market share concentration and competition: Although CRISIL leads the Indian credit rating industry like its parent, the market is more contested among the main players. The chart below maps the Indian market between FY 2013 and 2023 (limited due to lack of private company data). As highlighted, the three major players, CRISIL, ICRA and CARE Ratings, have seen their combined share decline from 83.9% in 2014 to 77.1%, far from Europe and the American market’s 90% domination by the big three.
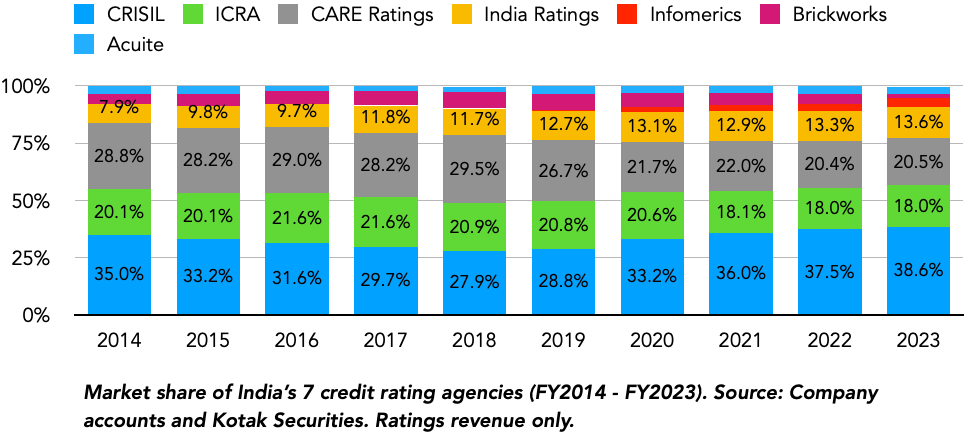
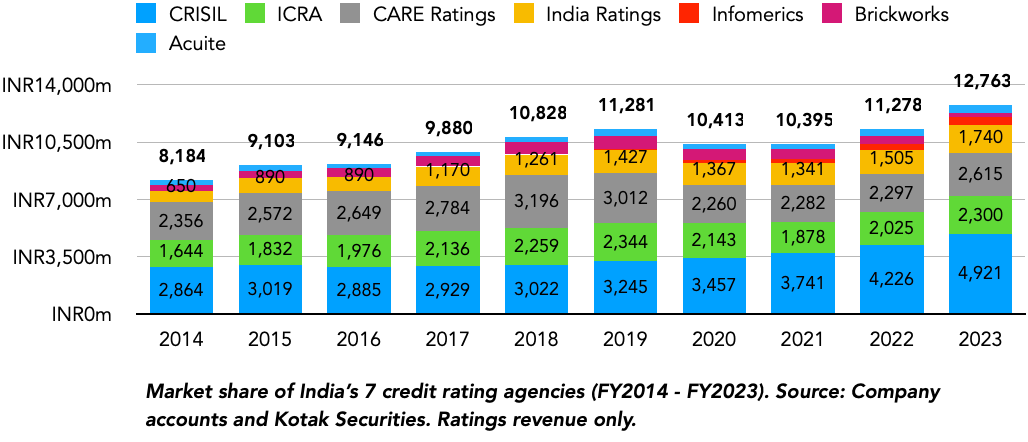
The main reason for the weakened big three concentration has been the growth of India Ratings, which is fully owned by Fitch and missteps by CARE Ratings and ICRA.
CARE and ICRA: ICRA, which is 52% owned by Moody’s and CARE Ratings, a fully domestic rating agency (CRISIL owns an 8% stake in CARE), have both lost share to other players in recent years. As shown in the chart below, when considering ratings-only revenue share of the big three, both companies lost significant ground, particularly in FY 2020. A contributor to this was their involvement in India’s non-banking financial companies issues in 2018, a segment CARE in particular had become more reliant on. IL&FS, DHFL, and Reliance Home Finance- three issuers CARE rated investment grade defaulted months later, denting CARE’s reputation and surveillance revenue as it had to continue monitoring their bank loans without earning any fee.
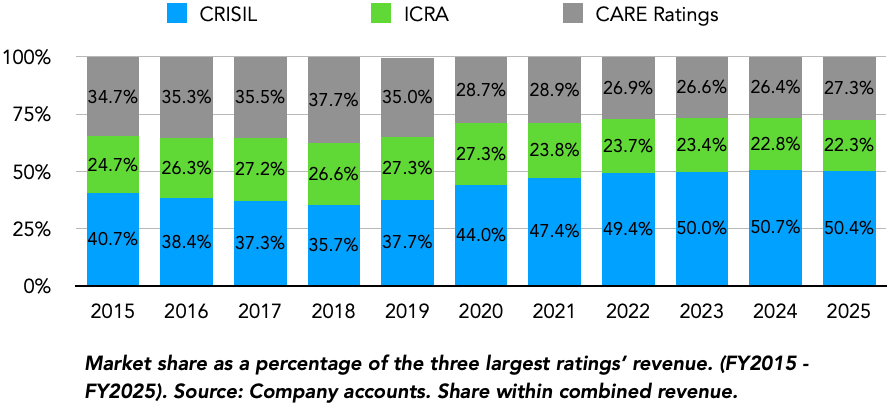
While CARE remains a key player in the bank loan market, ICRA made a more conscious decision to scale back its operations within the sub-market, focusing more on larger corporate, financial institutions and infrastructure customer segments.
Integration with parent companies: Three of the four major Indian credit rating agencies are majority-owned by global players, and the resulting impact is on the makeup of their revenue. For the publicly listed CRISIL and ICRA, the integration with S&P Global and Moody’s, respectively, has resulted in a parent-revenue reliance income statement. ICRA, for example, attributes nearly a third of its revenue directly to ancillary services for Moody’s, while for CRISIL, 38% of its INR 10.7 billion revenue from ratings is attributable to supporting S&P Global’s surveillance ratings business, called Global Analytics Services (GAS). The resulting impact is that, despite both being Indian companies, the true revenue exposure is more global and integrated with their parents and must be analysed through those lenses.
Macroeconomics: As we discuss in the risks industry, there’s no analysing the credit rating industry without gaining some perspective of the macroeconomic climate, and there are also material differences between the Indian economy and the rest of the global economy, leading to a net favourable impact for the domestic credit rating industry.
India’s growth story is often discussed, but an additional macroeconomic lever for the credit rating industry is the fairly robust debt profile and growth potential for corporate debt.
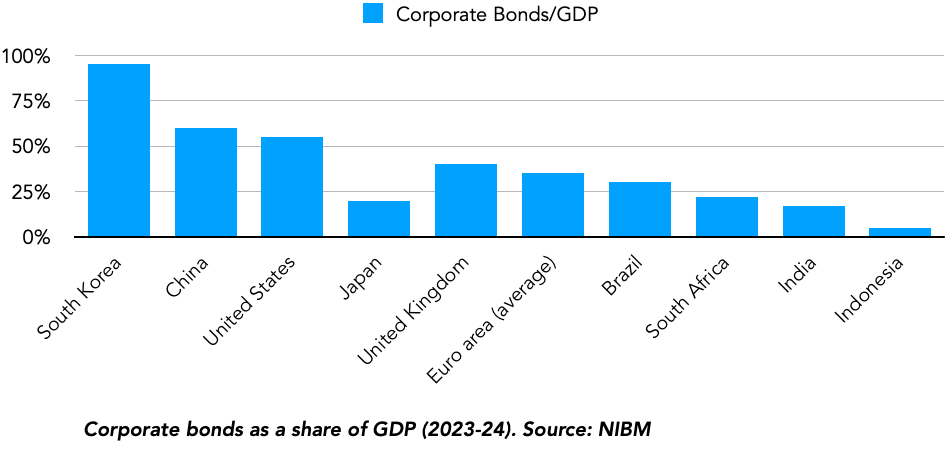
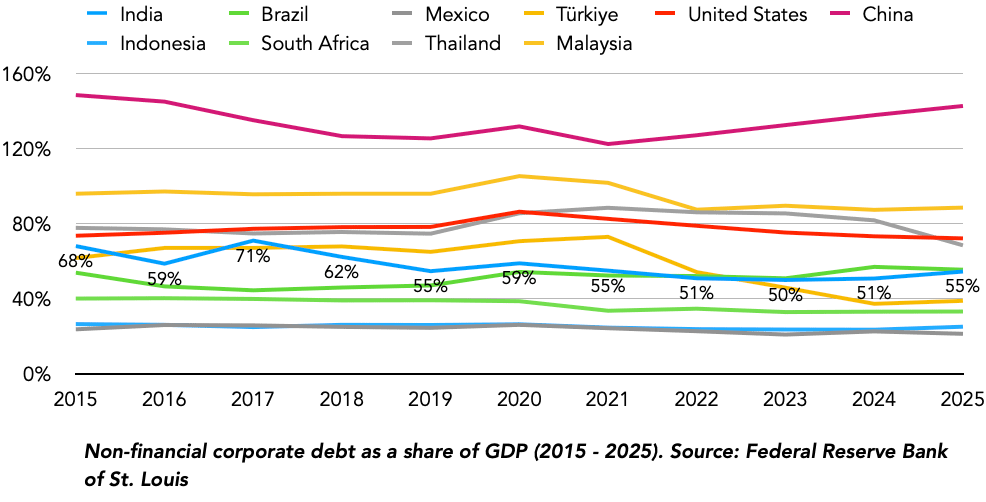
As highlighted in the charts above, India has a comparably low debt level relative to its peer emerging market group and has seen its non-financial corporate debt as a share of GDP decline by 13.6 percentage points, the second highest in the basket of 10 countries (chart above). Of course, we can’t simply conclude on a prolonged debt cycle growth without assessing relative metrics in interest coverage (median corporate net debt/EBITDA, corporate interest coverage).
That said, other country metrics such as the share of corporate debt rated investment grade, depth of institutional investors active in bond markets point to substantially higher capacity and credit rating penetration and coupled with broader assessments of India’s economy, I believe this points to substantially higher growth for the credit rating industry, supporting CRISIL’s growth potential. I discuss how these and other factors could contribute to CRISIL’s underlying growth potential.
4. Market Intelligence and Energy Market Data
Energy Market Data
S&P Global’s participation in the energy industry through its ownership of Platts dating back to 1953 is often overlooked by markets, but its profitability, currently above 41% operating margins, customer stickiness, benchmark and standards-based business model characteristics place the energy market data industry in the same league as credit ratings and indices.
Top-down information on the industry makeup, market share and growth track record is more limited for the energy market data industry, and to support the analysis of the industry, I have primarily relied on information provided by the European Commission, UK CMA and U.S. DOJ during their antitrust investigations into the S&P Global and IHS Markit merger.
The energy market data is broadly divided into two parts:
Commodity pricing and benchmarks
Market intelligence and analytics
Between the two, the former, commodity pricing and benchmarks, is the far superior and more attractive industry for S&P Global for a few reasons. The commodities industry relies on market prices often determined by calculations by price reporting agencies (PRAs), who in turn depend on market participants, traders and the broader supply chain for price estimations.
By nature, while several providers could make these estimations, industry participants often gravitate to one provider to ensure consistency across their price use cases: trading, hedging, among others. As such, the more data customers feed into a PRA’s pricing assessment, the more valuable and entrenched the PRA becomes, leading to strong network effects.
While I haven’t found an explicit breakdown of the PRA industry, 2020 data shared by S&P Global and IHS Markit with European and British regulators ahead of their merger revealed important insights into the market position and competitiveness across the various commodities benchmark pricing categories.
As you would see in the table, the regulatory disclosures don’t reveal exact market share data, but rather range estimates across the 9 major energy categories from biofuels to shipping.
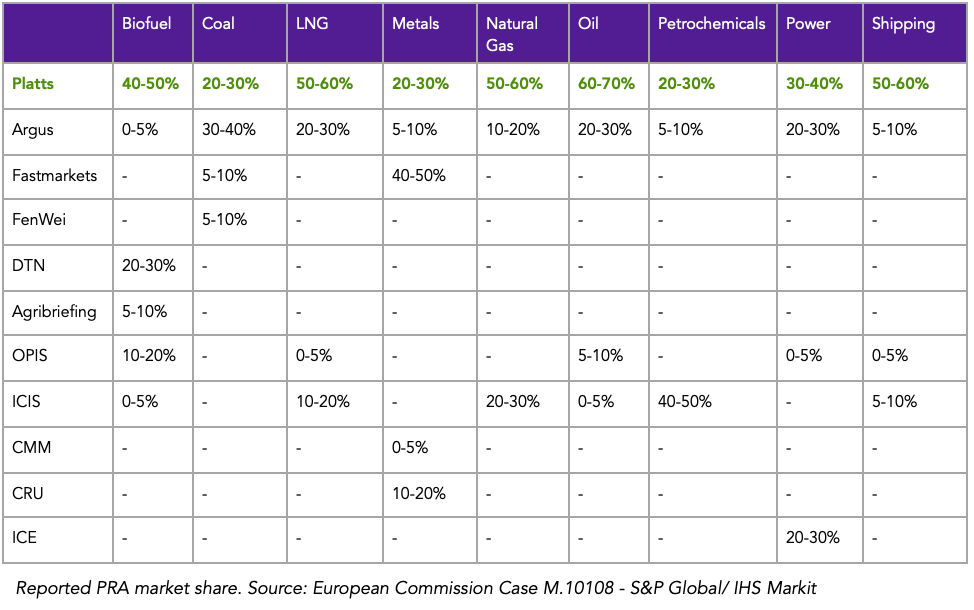
Platts and Argus, and to a smaller extent ICIS (owned by RELX) and OPIS (previously owned by IHS Markit but sold to News Corp as part of the merger agreement), dominate the various categories, with Platts leadership most present in oil, shipping, LNG and natural gas.
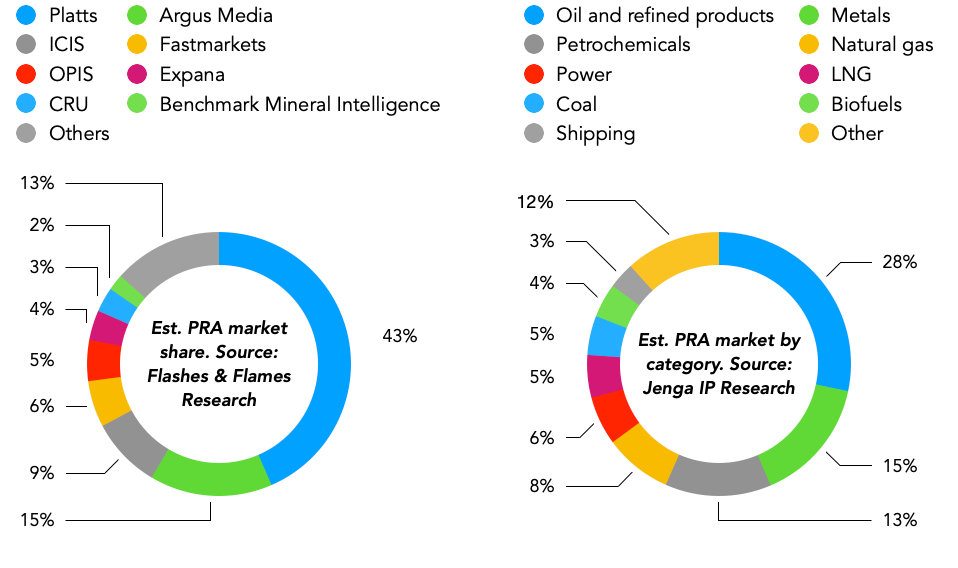
Investigation into the reported regulatory data confirms some of my conclusions on the industry’s high quality characteristics.
First mover advantage: Fastmarkets, through Metal Bulletin, early entry into metals pricing at the start of the 2000s has protected its superior market share in the face of larger PRAs like Platts. Within metals, Platts has only successfully challenged Metal Bulletin in Iron ore, after the industry shifted from annual pricing to PRAs-led market pricing assessments.
Barriers to entry: Over the last 20 years, Iron ore, alongside battery-grade lithium hydroxide, U.S. Gulf Coast crude and premium coking coal transitioned to PRA pricing assessments, and the eventual benchmark market leader ended up being one of the existing players (Platts, Argus and Fastmarkets), proving just how difficult new entry is. These incumbents weren’t without new challengers; General Index, backed by former Platts executives like Jorge Montepeque, has tried to replace Argus in European gasoline benchmark data, but so far, the incumbents remain the industry standard.
Growth through new commodity categories: The strong barriers to entry mean the rise of new commodities, as we have seen with iron ore, biofuels and LNG in certain geographical markets, leads to a natural organic growth option for incumbents like Platts and Argus.
The structural quality of the energy market data industry was similarly echoed by regulators, who forced S&P Global to sell IHS Markit’s operations in petrochemicals (PetroChem Wire), chemicals (Base Chemicals), oil (OPIS) and coal (CMM) in a total $1.445 billion sale package to News Corp. As such, the opportunity for acquisition-led growth is very limited, and I will discuss how this shapes the growth opportunity for S&P Global’s energy PRA.
Energy Market Intelligence and Analytics
Compared to the oligopolistic PRA market, the energy market intelligence and analytics segment is certainly more competitive, less profitable and generally of lower quality. To support this view, I also rely on data provided to regulators, as broad-based industry data isn’t publicly available.
Similar to the PRA industry, energy market intelligence and analytics is structured around particular commodities and is broadly divided across 8 capabilities, ranging from trade analytics and sugar to power and freight rate forecasts.
The table below highlights some of the respective market leaders according to the report, and some data reveals insights worth discussing.
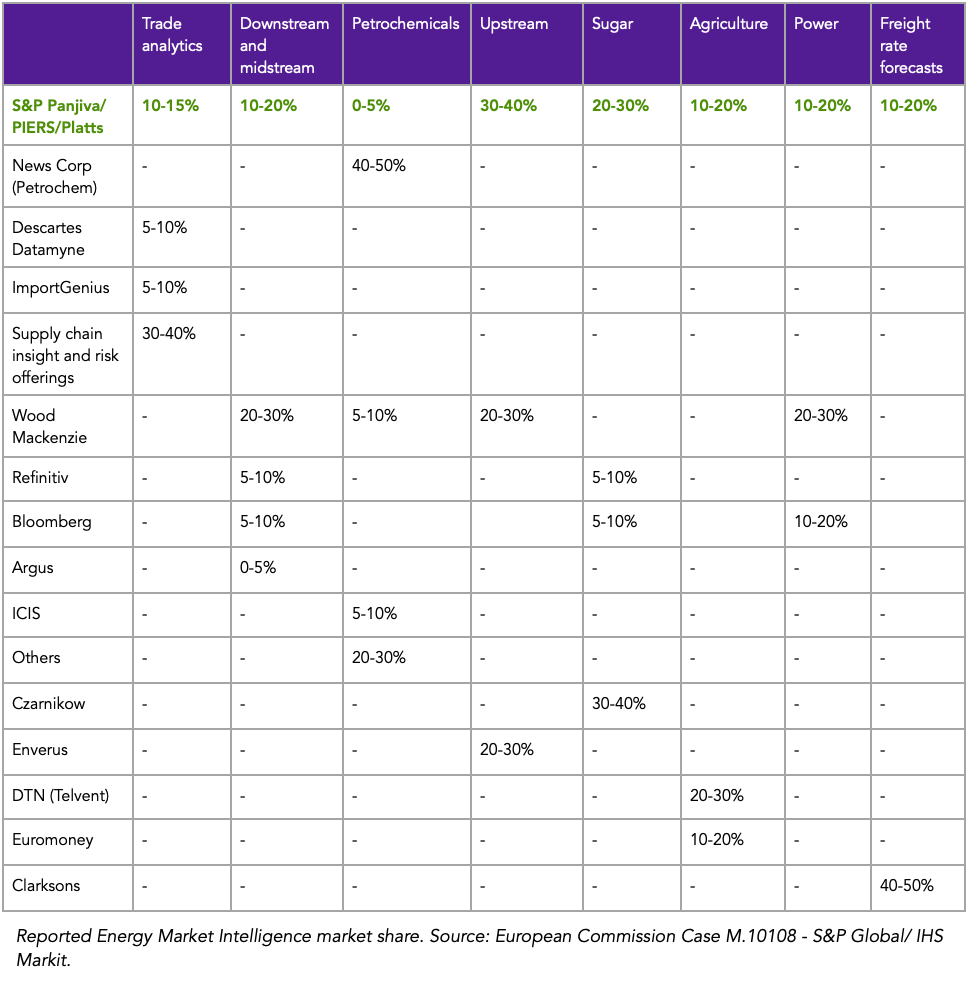
First, compared to the PRA market, individual players with 30%+ market share are much less common, and categories where we see this, such as sugar with Czarnikow and freight rate forecasts with Clarksons, tend to be specialists focused on single categories. The key reason behind this is the lower barriers to entry. In trade analytics, for example, S&P Global’s Panjiva competes with a broad range of participants, from specialists like Descartes Datamyne, consultants like McKinsey and Accenture, to supply chain insights groups like Altana and Interos.
Second, among the reviewed players, only Bloomberg and Wood Mackenzie actively compete with S&P Global across multiple sub-categories, which is less competitive overlap than we saw in the PRA industry. The reason for this is that, unlike in PRA, brand recognition, expertise and credibility are less transferable into another category, as was the case in PRA. For example, sugar and power have very different primary drivers (electricity demand versus crop yields), models (generation economics versus crop forecasts), and customer base (utilities versus agricultural traders), leading to very little room for competitive overlap.
The result of these is that we have a lower margin and a less oligopolistic structure across intelligence and analytics. For S&P Global, unlike in PRA, the business driver here is mainly acquisitions into newer and faster growing end-markets. Lately, they’ve entered end markets like data centres with the acquisition of DataCenter Hawk and hydrogen with World Hydrogen Leaders, and I expect these acquisitions to play a key role in the energy division’s growth.
Market Intelligence
The last of the four relevant S&P Global industries is financial market intelligence, an industry we extensively covered earlier in the year with my deep dive and investment case for FactSet. Since that analysis, the publicly available industry data, as well as my industry understanding, have both broadened, so rather than retelling previously shared analysis, I’ll focus on what’s changed and then look at the industry from S&P Global’s perspective.
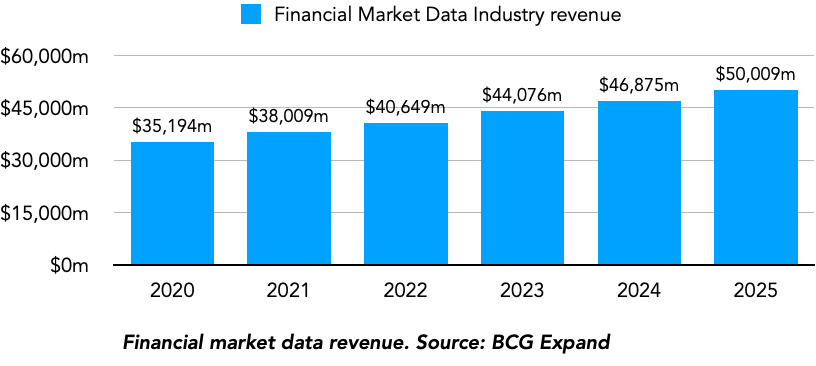
Artificial Intelligence, as well as the vertical integration across financial market data terminals and platforms, has broadened the scope of what qualifies as financial market data and, as presented in the chart below, data provided by BCG Expand now estimates the broader financial market data industry at $50 billion, a compounded growth of 7.2% over the past five years.
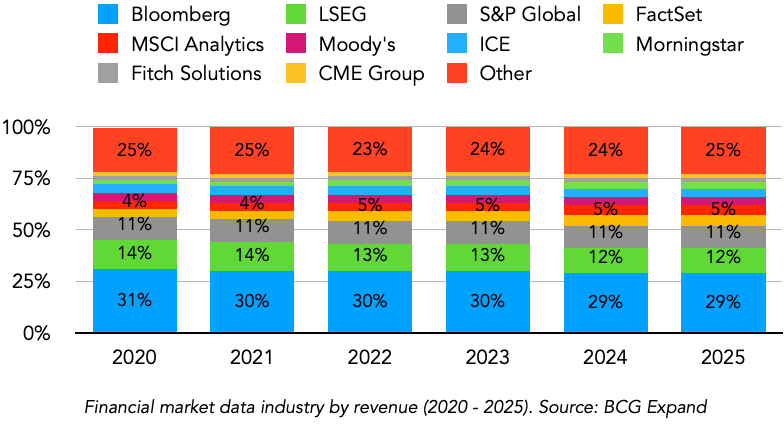
While there are various ways of defining the relevant industry, S&P Global’s Market Intelligence division goes beyond Capital IQ and the financial workstation solutions, and we must consider all relevant sub-segments in our map. To achieve this, two charts particularly stand out. First, the BCG Expand market share chart (see below) compares the market share of the ten largest companies, and here, we see S&P Global holding steady in third place, with an 11% market share.
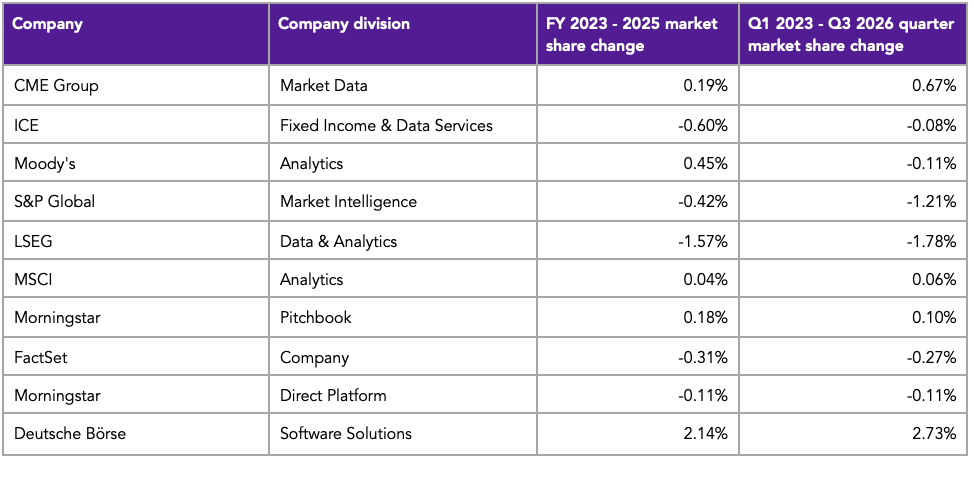
Given our limited insight into the BCG Expand dataset, I created my own industry dataset, covering the quarterly revenue of ten publicly listed divisions across the major industry participants, and then compared their share through the quarters (see charts below).
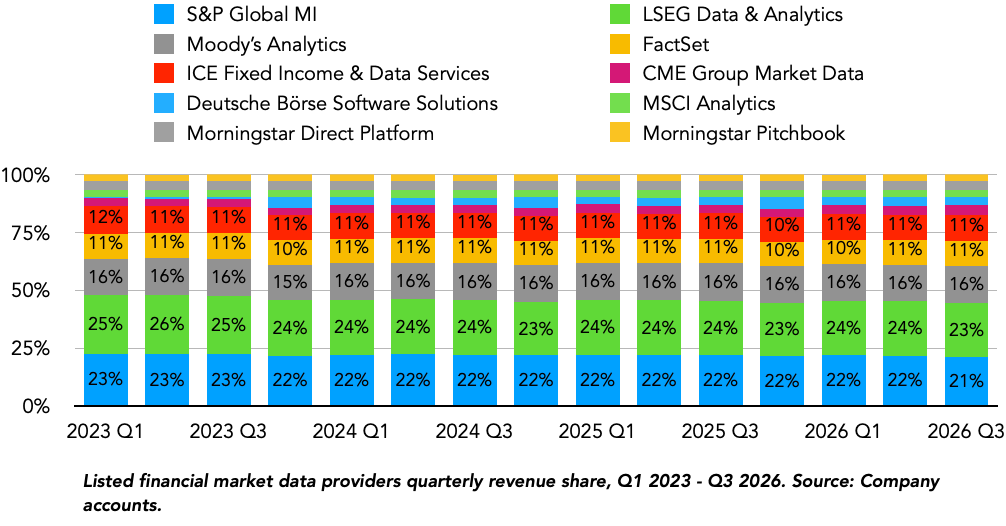
As you can see from the chart, there have been some market share changes over the period, with Deutsche Börse Software Solutions division gaining the most share of 2.73 percentage points, mainly driven by its 2023 acquisition of SimCorp, a portfolio analytics tool. LSEG Data & Analytics and S&P Global Market Intelligence, the two largest by market share, were also the biggest losers by percentage points, losing a market share of 1.78pp and 1.21pp, respectively, between Q1 2023 and Q3 2026.
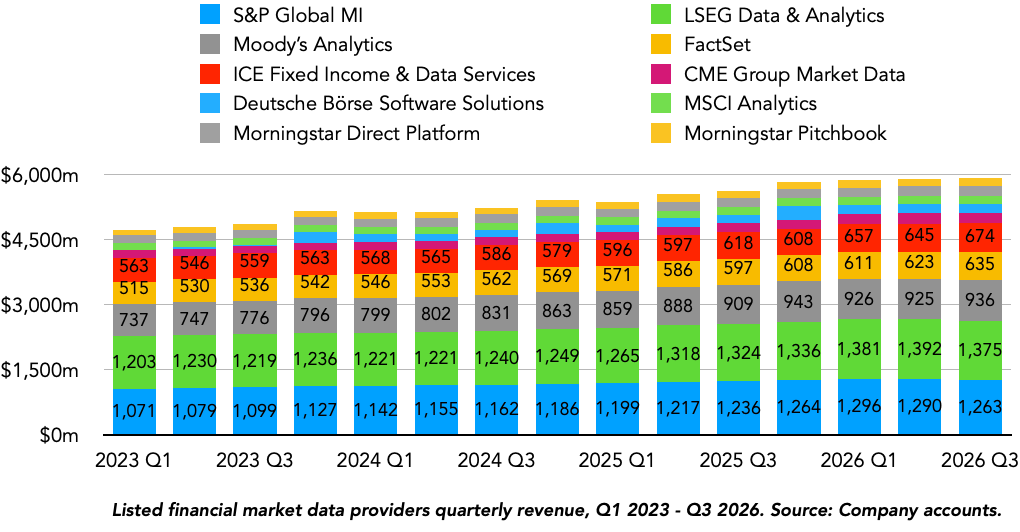
As you might imagine, their inclusion of acquisition growth complicates any industry analysis here, and I decided to take the research deeper, exploring the product-level features across 25 capabilities (e.g. public company fundamentals, credit & insurance analytics) and an 18-category competitive scoresheet (e.g. portfolio analytics, multi-asset risk and stress testing).
You can access the 25 product factory category sheet here.
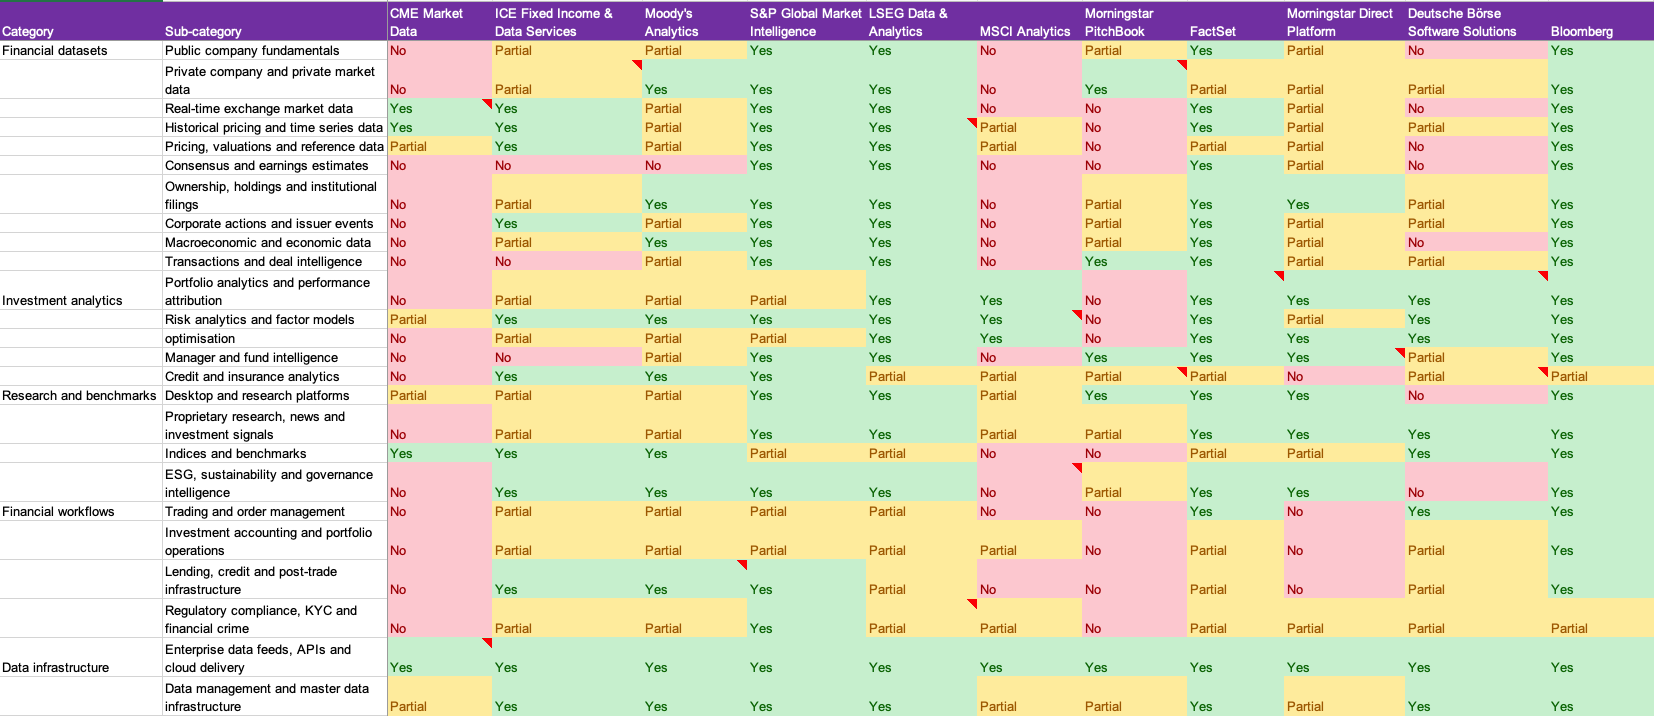
You can download the 18-category competitive scoring sheet here.
Note that my scoring and dataset here is a culmination of a year of extensive and ongoing research into the industry, learning about the intricacies, demoing and testing products and speaking with industry experts. While it would be lengthy to dive into the justification for each data point and conclusion above, it would be more helpful to discuss the concluding thoughts relevant to S&P Global more specifically here.

All-weather solutions: S&P Market Intelligence, alongside LSEG and Bloomberg, is one of the three all-weather financial market data platforms, providing a tool for nearly all market participants. Years ago, being all-weather was enough, but today, especially upon reflecting on S&P Global and LSEG’s market share losses, it is no longer enough. An open software architecture for these all-weather companies is increasingly becoming more important to support growth through APIs, MCPs and cloud delivery. Today, each of these major players has added MCP tiers to enable customers to utilise AI models for data analytics.
“Demand for our mission-critical data is very strong, and we launched Ratings, Energy and Visible Alpha data in MCP during the quarter. What we hear consistently from customers is that they are choosing S&P Global data because it’s highly performant with lower error rates compared to other providers” - Martina Cheung, S&P Global CEO, Q3 2026 earnings call.
“Over 2/3 of our largest customers and over 300 in total have now connected or are onboarding to our MCP.” David Schwimmer, LSE Group CEO, Q3 2026 earnings call.
Proprietary data: CME and ICE led the group in my ranking on proprietary data due to their ownership of exclusive datasets; SOFR futures for CME Group and fixed income for ICE. As we will discuss in the next section on AI risks, proprietary data is an important aspect in business and AI defensibility, and I believe this will become increasingly important for all financial market data companies. I suspect LSE Group and S&P Global, with more weighting towards non-proprietary data, have limited pricing-led growth potential when compared to CME, and both may lean more towards volume growth to drive market share.
Public or private coverage: Moody’s and S&P Global went down different paths to diversify from ratings. Moody’s focused more on private markets data (Orbis, Cortera and Regulatory DataCorp), while S&P Global was more focused on public markets (Capital IQ, SNL Financial) due to the vast volume of potential users. S&P Global’s most recent purchase of With Intelligence reflects the current industry sentiment for private over public market data, given its now structural growth potential. For S&P Global, I suspect we are likely to see even more acquisitions of complementary private market data assets. That said, acquisition valuations aren’t likely to come cheap. More discussed in the growth analysis (section 7).
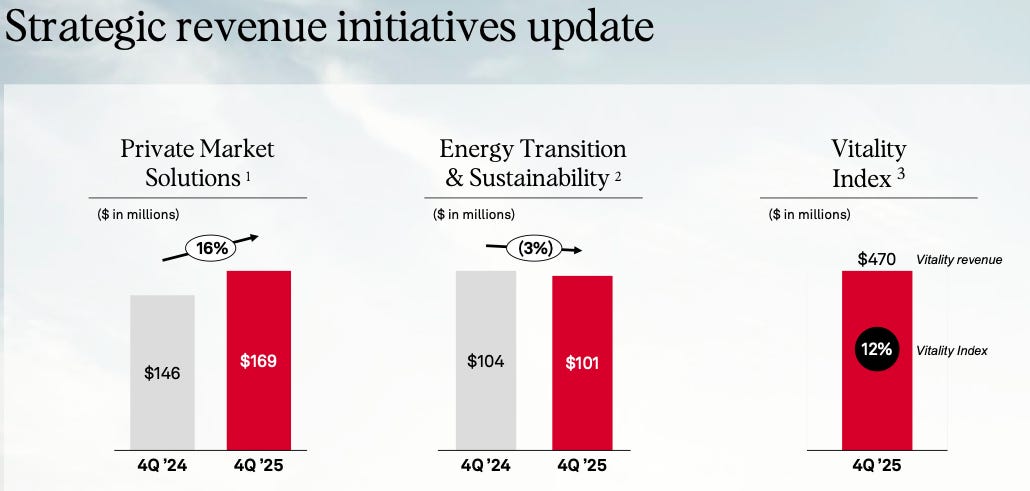
In recent months, S&P Global has made additional steps to segment its Market Intelligence division, first by splitting it into Kensho Data Platforms (60% of MI revenue) and Enterprise Solutions (40% of MI revenue), and setting up a spinoff or sale of Kensho Data Platforms. In our business economics analysis (section 6), I will discuss more about its economics and what a sale might mean for S&P Global’s valuations, and also include a valuation by parts in our valuation analysis (section 9), which will summarise my thoughts on Kensho Data & Platforms (section 12). (se
5. The AI Impact and Opportunity
Objective: Analyse and synthesise thoughts on S&P Global’s AI risks, opportunities and overall impact across its various divisions and to the whole company.
AI being the most important technological shift today means we must dedicate some thought exclusively to how it impacts S&P Global. As at the investment purchase date, 5th October, 2026, S&P Global’s shares have declined by 25% YTD, and the most significant contributor to the decline was the 16% drop in February, when markets worried about how AI disrupts S&P Global and other market participants.
I will tackle this topic by reviewing each division, highlighting both sides of the AI argument and then discussing my concluding thoughts, supported by insights gained from assessing its products, industry and broader research.
Ratings
Ratings AI threats
AI reduces the demand and mission-criticality for investors’ access to and use of surveillance ratings data.
Non-transaction ratings revenue such as surveillance fees have helped diversify S&P Ratings away from lumpy one-off transaction revenue (52% of revenue), and while S&P Global has benefited from it, AI could attack its customers’ demand and economics. While the formal annual rating review will always be required from a regulatory standpoint, bears argue the more frequent creditworthiness checks could become less frequent as investors and issuers gain real-time updates, thus leading to less pricing justification for the user.
However, I suspect the more frequent surveillance portion is financially bundled with annual surveillance for issuers, leading to a more difficult separation of fees to investors and minimal impact.
AI makes ratings even more cyclical.
This is likely true especially in the short and medium term. Moody’s, for example, mentioned that AI is currently half of issuance growth and reflected 40% of its revenue growth, indicating the ongoing hyperscaler debt boom is already having a meaningful impact on credit rating economics.
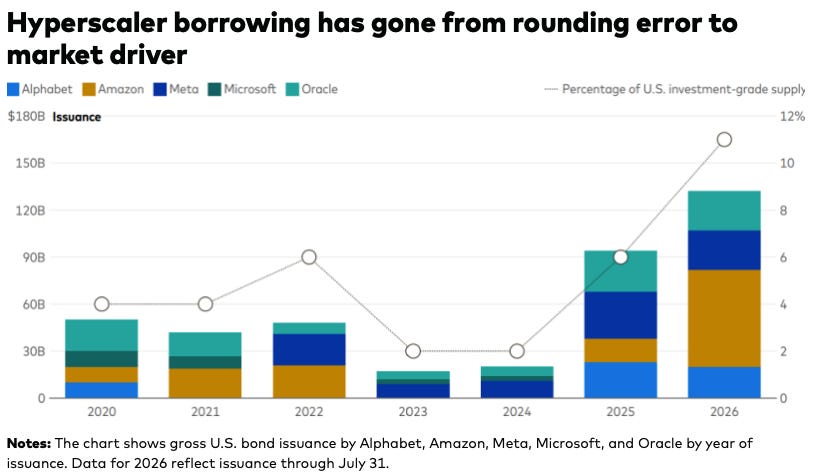
Without free cash flow generation and substantial return on capital, the ongoing AI debt boom will be unsustainable, and one should expect the rating agencies’ revenue volatility to follow a similar path.
From a valuation and growth standpoint, I recognise the inherent cyclicality of ratings and generally estimate a base case scenario across all ratings growth forecasts.
AI creates new competitors, and smaller agencies gain more competitive advantages.
My research indicates some new competition. AIR Platforms is a credit intelligence company founded in 2024 by Glenn Carvajal, a Moody’s alum, using AI to improve ratings with real-time access for investors. AIR claims to have used AI to detect First Brands credit deterioration earlier than peers and is already partnering with S&P Global investor clients by providing unsolicited credit ratings. AIR Platforms isn’t registered as an NRSRO in the U.S., and I suspect it’s had no impact on the major rating agencies to date.
Perhaps the even more significant risk for S&P Global is existing NRSROs using AI better than they do, spotting hidden risks better and taking more market share in sub-segments like structured finance and bank loan ratings. From my research, Moody’s seems to be sharing significantly more information than S&P Global on how it utilises AI in ratings, and while I wouldn’t use this to conclude it’s better equipped for an AI world, I do think it’s something worth watching carefully.
Ratings AI opportunity
AI leads to more global investments, debt and ratings volume
A case can be made for AI leading to lower moats (switching costs and barriers) across other industries, leading to more investments, corporate debt and issued ratings. In my view, I believe this is structurally more likely than simply growth in hyperscalers only, as is today. Research by CEPR found that industries with higher task-level exposure experienced 20% more startup formations, and while startups aren’t drivers of credit ratings issuance, the competition they pose to incumbents and large enterprises drives rating activity and is something worth tracking for the future.
AI reduces the cost of surveillance and distributing RatingsXpress
According to NBER, the average ratings analyst covers 14.7 companies, representing $161 billion per analyst. With AI-enabled productivity, agencies could increase this to 17 or even 20, leading to improved cost efficiencies in ratings surveillance. Equally important, though, is the revenue growth opportunity and while the ratings AI upside is attributed to Market Intelligence through RatingsXpress and RatingsDirect, S&P Global recently announced it has launched access to RatingsXpress through MCPs, and I suspect over time, usage could drive mild revenue growth for the ~$500 million division.
Overall, while there are multiple ways AI impacts ratings, as discussed above, I don’t see a structural change (upside or downside) to ratings from AI and expect the most impactful effect to be AI-led debt issuance on ratings volumes.
Indices
AI threat
The AI bubble has driven the S&P 500 to unsustainable levels
S&P estimated that the Magnificent Seven companies represented 42% of the S&P 500’s 2025 returns, while Sit Investments, a broader group of 42 AI-related stocks, represented nearly two-thirds of the index’s performance. Of course, such concentration isn’t sustainable forever, and we can conclude a large share of recent S&P indices’ revenue strength is driven by these AI-related stocks. For my long-term growth assumption, see growth analysis (section 7), I normalise the underlying asset-linked AUM growth to 9% and discuss how my base case growth assumption trickles into S&P Indices revenue and earnings.
AI shifts value chain power to ETF providers
As we will discuss in the business economics analysis, bargaining and pricing power have already quickly shifted from indices to ETF providers, and I imagine a situation where AI further tilts this in favour of ETF issuers. This situation could be more pronounced if investors value the product franchise (e.g. iShares) over the index (e.g. S&P Indices) and if investors use robo AI-powered advisors for lowest-cost products, funds with lower cost ratios (larger scale, lower fees to index) might be favoured, thus tilting the pressure on ETF providers.
As you might sense, while this is possible, from the description, it’s quite complex and unlikely to occur in an instance. The S&P 500 franchise, which dominates asset-linked revenue, is most likely the world’s most popular and sought after product, meaning it’s well more defensible than peer indices.
AI opportunity
AI leads to higher GDP, growth, stock market activity and prices.
Similar to ratings, Indices is a “GDP growth +” business and higher GDP and economic activity from AI, as we currently see, could structurally drive stock market prices, investor preference towards passive funds and boost revenue for S&P Indices. Of course, a pushback is that economic growth doesn’t necessarily trickle to stock market growth, true, but with large AI-enabled businesses like SpaceX, Anthropic and OpenAI going public, investors are likely going to demand exposure to these companies through domestic indices and custom tech-oriented solutions.
Overall, in my view, I think Indices will be the most resilient to AI shocks when compared to the other three S&P Global divisions. As you see, the main impacts are second- and third-order activities, and I believe these have an equal split between being a positive or negative factor for S&P Indices.
Energy
AI threats
AI systems bypass or replace the PRAs
While this is technically possible - an AI system collecting pricing from Platts 15,000 assessments in real time, feeding into a system and pricing a commodity - there are many hurdles to achieving this, from relationships with market participants to submit contracts, differentiating what data to include and, the hardest, getting users to adopt a new benchmark when one with decades of track record already exists. The more likely risks are exchanges enabling AI agents as representatives of participants (refiners, airlines, etc.) to talk to each other, negotiate and conclude on prices, and this is where the “standard benchmark” advantage helps Platts and other PRAs.
Energy market data and energy databases become commoditised
The threat to CERA and the analytics segment of Energy is more substantial because AI opens clients to more and potentially cheaper alternatives to the industry leaders (CERA and Wood Mackenzie), while also making consulting lumpier as clients bring what they previously outsourced in-house due to costs. Of course, I don’t treat this segment as all equal. CERAWeek will likely sell tickets and remain the bellwether conference for the energy industry decades from now. However, I’m unsure if CERA forecasting models and research commentary will remain as valuable as they’ve been in the past, and I do believe there will be some market share loss from AI.
AI opportunity
Data feeds, APIs and MCPs
S&P Energy’s breadth across various commodities and datasets puts them in what I believe is the best position in both PRA and energy market intelligence industries to extend its solutions through APIs and MCPs, and, more importantly for the business economics, monetise it at high margins. My main rationale behind this point is that many large enterprises aren’t isolated energy data users; trading houses have several teams and would rather select one partner who can provide several datasets, rather than one specialist everywhere.
This also supports the strategy of bolt-on acquisitions of companies with proprietary data, as we saw with datacenterHawk in data centres and World Hydrogen Leaders in hydrogen. Combining these with other datasets like CERA Titan (upstream oil and gas) and LNG Analytics becomes even more valuable in an AI world, as it broadens distribution for S&P Global.
While it has been fun to imagine various possibilities, the “benchmark standards” Platts has makes it, in my view, highly resilient to AI.
Market Intelligence
AI threats
Capital IQ becomes irrelevant
Management has repeatedly flagged that Capital IQ Pro alone is under 6% of S&P Global revenue, and even less as a share of profits. The reason why management has highlighted this fact is that Capital IQ Pro is central to the AI debate among markets and the main reason for the 25% decline experienced in S&P Global shares. My first-hand experience with Capital IQ Pro has led me to conclude that AI hurts its distribution edge over peers like FactSet, but does not make it obsolete.
During our research, we trialled several S&P Global products, and with prices quoted from our sales rep, I was quoted 25% for an MCP uplift and a 50% uplift for a bundled Capital IQ Pro with Visible Alpha. To me, this is first-hand insight into ways Market Intelligence defends itself from AI, a point we further discuss in our growth analysis (section 7).
Does Market Intelligence have proprietary data?
With AI, asset managers can directly source data from regulatory filings, making Compustat datasets like earnings transcripts, historical financial data and even some once-proprietary datasets within SNL Financials’ banking and energy operational data no longer proprietary. Even if companies still choose S&P here over their own AI agents, the fact that there’s a direct-to-data alternative simply weakens S&P Global’s pricing power for the future.
There’s also a difference between proprietary data (e.g. Visible Alpha) and proprietary data that is benchmarked as an industry standard (S&P 500), and sadly, for market intelligence, its proprietary data, at the moment, falls in the former.
AI could reduce seat-based growth and long-term demand
Among all risks mentioned in the section, I believe this is the most likely risk that might happen. Historically, Kensho Data & Platforms solutions like Capital IQ Pro, With Intelligence and others were seat-based, and there’s a real chance that previous growth drivers for their end-user seats don’t match the last ten years.
In S&P Global’s defence, they were more flexible and adaptive with pricing, moving from a seat-based focus to an enterprise-focused model, meaning that employee cuts at end users would probably have a lower impact on its revenue, when compared to peers like LSEG Workspace and Bloomberg.
This, of course, doesn’t protect Market Intelligence from a structural longer-term demand growth cut, and I reflect this view in my market intelligence long-term growth projections.
AI opportunity
Tokens, MCPs and data feeds growth potential
While the Market Intelligence Kensho Data and Platforms segment is likely the most impacted by AI among all of S&P Global’s 8 sub-divisions, it also has the biggest upside from direct AI uplift through monetising MCP access and connecting users better with data feeds access. Again, S&P Global is well placed for this world given its diversified base from indices to energy and multiple touchpoints with customers. In our market intelligence model, I believe that at least 25% of market intelligence growth could come from both direct and indirect AI monetisation.
In the market intelligence AI analysis, I’ve solely focused on Kensho Data & Platforms, the segment most at risk from AI. As an investment case, we must also consider enterprise solutions, and when I reflect on tools like ClearPar, Wall Street Office and iCompliance here, not only are these tools AI resilient, but they also have a product moat from data security and regulatory requirements supporting their overall defence against technology shifts. Of course, the growth potential is much slower here, and there’s little room for “MCP-uplift” to pricing, but still, I believe its stability is handy when considering S&P market intelligence division investability.
S&P Global, the organisation
To conclude the AI analysis, it’s important we also reflect on how AI impacts S&P Global at an organisational and corporate level: how it recruits, competition for talent, driving sales, and how AI contributes to the business.
Analyst productivity: As we discussed in the ratings segment, there’s a world where AI drives the average number of companies covered per analyst from 15 companies to 20 companies, driven by AI productivity boosts. For S&P Global, this is directly incremental to cost savings, and I estimate we could see additional cost savings and margin expansion from AI in ratings and also in market intelligence, which I believe is the most labour-intensive segment.
Competition for talent: Early indications show that S&P Global, as well as other incumbents, would be worse off in the competition for talent. A good example is the loss of Saugata Saha, a former executive credited with simplifying sales and customer pricing in the market intelligence division, who’s now left to lead Qlik Technologies. Similarly, its Chief AI officer, Bhavesh Dayalji, announced he was stepping down last month (Sep 2026) and reflects this challenge. Also, S&P Global had historically leaned more toward internal promotions for executives (Dave Ernsberger in Platts, Yann Le Pallec in Ratings), but with AI destabilising several parts of its value chain, external hires, such as Firdaus Bhathena (formerly CTO of FIS), indicate changes to S&P Global’s culture and something investors might want to watch over the long term.
Sales: Given AI is directly monetised through its connectors (MCPs and data feeds), sales renewal cycles and the importance of the enterprise relationship will play an even greater role for S&P Global. From my research and first-hand experience, having attempted to purchase and trial several S&P Global products, it became clear to me that its many acquisitions over the years have kept its sales process less integrated across teams, with sales still quite product-focused rather than solutions-driven. For example, a With Intelligence sales staff member I spoke with hadn’t realised I was already pitched With Intelligence through a Capital IQ Pro add-on. With AI, I think we can see an uplift in organic growth, particularly in recently reorganised divisions: energy and market intelligence.
With the product, industry and AI opportunity now set, let’s move to the numbers, covering business economics, growth projections and valuations.
6. S&P Global’s Business Economics
To analyse S&P Global’s business economics, I will split its operations into the four official company divisions:
Market intelligence
Energy
Ratings
Indices
I will explore the revenue and cost structure for each and then conclude with an overall note on the corporate-level cost and profit structure, as well as a unit economics analysis with BlackRock, the world’s largest asset manager, as the unit customer.
Note: The analysis below focuses on 2016 and 2025. While we have financial data from 2015 for the Ratings and Indices divisions, Energy and Market Intelligence were merged into one division until 2018, with individual group economics starting from 2016.
For each division, I will prioritise assessing their revenue by revenue stream (subscription, asset-linked) over revenue by sub-division (e.g. energy - CERA and Platts), as the latter has changed periodically over the years. This is one of the drawbacks of analysing conglomerates, as we learned from analysing Microsoft and Metlen.
Before getting into the analysis of each division, I first want to highlight two charts mapping out S&P Global’s revenue and EBIT share by division between 2016 and 2025.
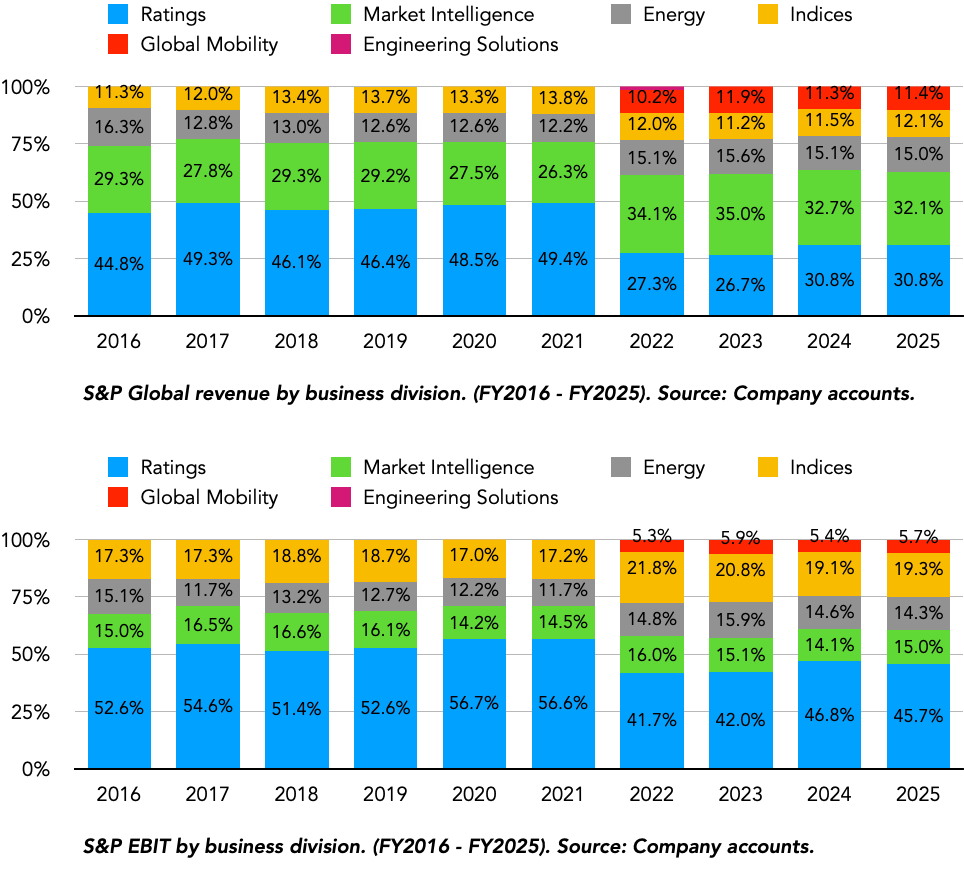
As you can see in the charts above, some divisions are more profitable than others. In 2025, Market Intelligence was slightly larger than Ratings as a share of revenue, but Ratings EBIT was three times larger than Market Intelligence. We’ll discuss more about this over the course of the business economics analysis, but it’s important to keep this in mind as we progress through the analysis.
Market Intelligence (32% of revenue, 15% of EBIT)
Initially created in the early 2000s as a distribution channel for S&P proprietary financial data in ratings and indices, the 2004 acquisition of Capital IQ formalised the Market Intelligence division. Market Intelligence was initially merged with energy and later split off as its own division given its above-average and less cyclical revenue growth. The chart below highlights Market Intelligence revenue growth and EBIT margin between 2016 and 2025.
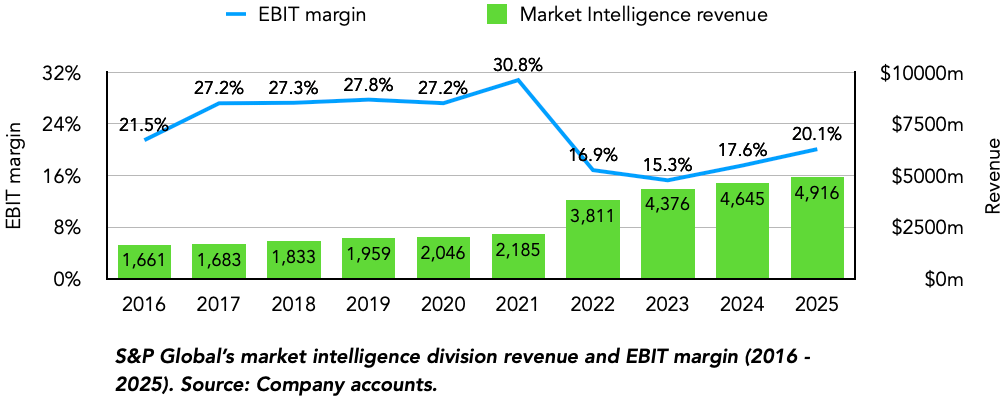
Prior to the 2022 IHS Markit acquisition, Market Intelligence was predominantly half Capital IQ, a quarter RatingsDirect & RatingsXpress and a quarter reference data (GICS & CUSIP - now sold to FactSet). Users initially mainly paid per user, but between Q3 2017 and Q4 2018, S&P Global made a conscious decision to switch from a per-user business model to an enterprise-wide revenue model, while still maintaining its subscription model.
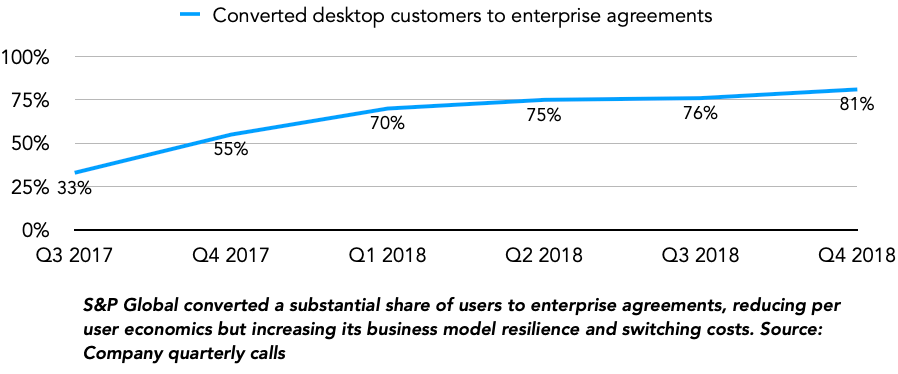
This is an important point because today, with the ongoing explosion of API/MCP revenue opportunities and fears of user-based pricing, Market Intelligence is much better placed than its peers to withstand the shocks. Of course, there are some drawbacks, and while we don’t have revenue per user data, I suspect Market Intelligence is substantially lower than its peers (FactSet, LSEG and Bloomberg).
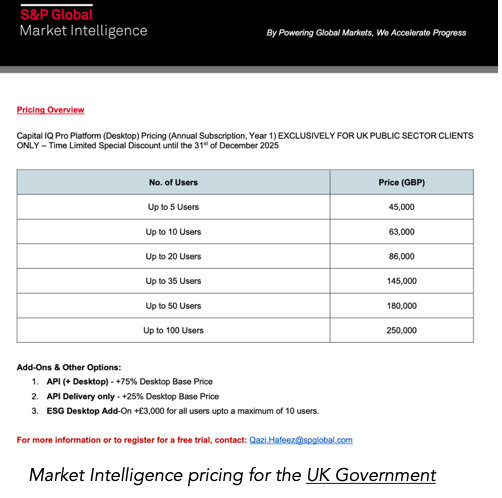
The IHS Markit acquisition added roughly $1.7 billion in gross revenue (before CUSIP and LCD disposition), and from the several charts above, you’d notice Market Intelligence’s EBIT margin declined in 2022, from 30.8% to 16.9%, while recurring variable (revenue linked to bond issuance and portfolio valuations) increased from 0% to 10.1%.
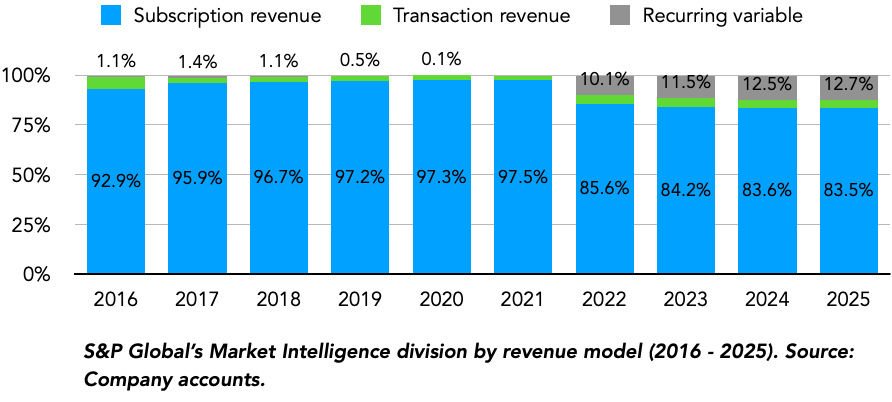
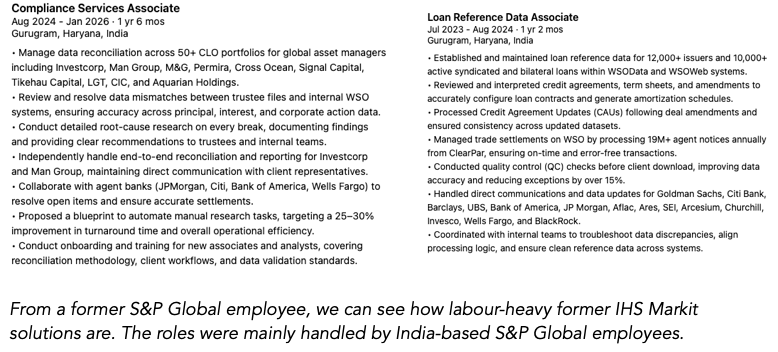
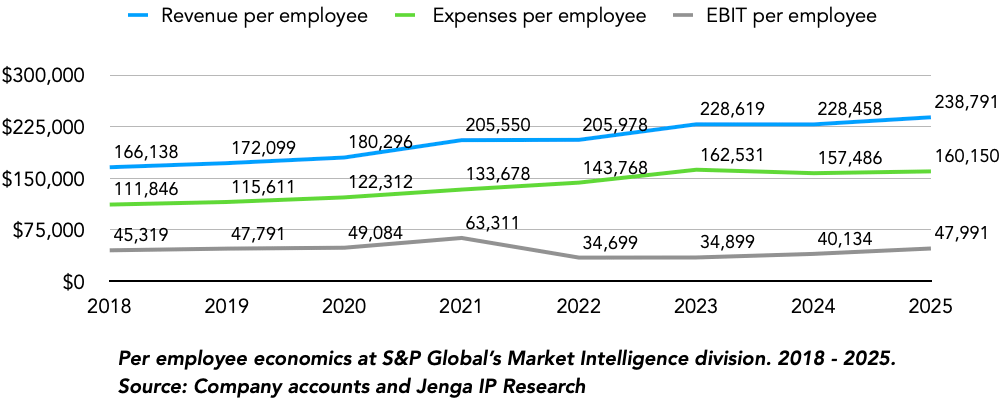
Unlike at Capital IQ and reference data royalty solutions (Compustat, GICS, etc.), IHS Markit’s enterprise solutions have substantial marginal costs, with additional customers leading to an overall asset-heavier cost base. Tools like Wall Street Office, KYC and iLEVEL each have substantial managed services solutions for customers with incremental staff costs, and this is evidenced by the per-employee expenses and EBIT decline between 2021 and 2022.
Market Intelligence cost structure
Margin expansion is expected to play a big role in Market Intelligence’s near-term growth, and the reason behind this is the cost savings across all recently acquired businesses. The first wave of S&P Global’s attempt to improve costs in Market Intelligence was through the acquisition of Kensho in 2018, founded by Daniel Nadler. Two primary operating cost lines are internal and external labour hired for earnings call transcription and financial document cleansing. With Kensho, S&P Global could do more with fewer people and between 2018 and 2021, employee count declined by 3.6% while revenue increased by 19% during the same period.
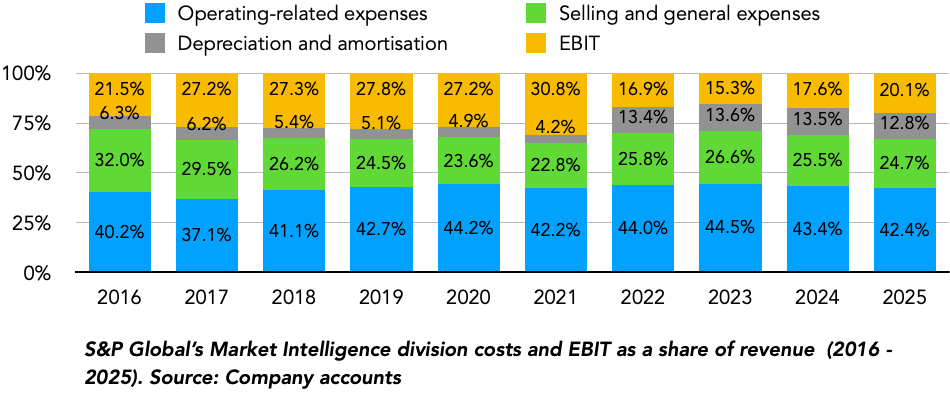
While IHS Markit added 78% more revenue to Market Intelligence, it also added 75% more staff, to 18,502 employees, and S&P Global restructured its employee base, separating decentralised staff from centralised staff (Enterprise Data Organisation), who use technology to serve all divisions, saving software licenses, staff and outsourcing costs. This might sound like a small thing, but it’s played a huge role in cost savings, and with additional AI tools, I suspect Market Intelligence could see further employee cost reductions.
In the unit economics section, I’ll walk you through how I view Market Intelligence unit economics with BlackRock as the case study and discuss how the cost savings feed into our growth assumptions.
Energy (15% of revenue, 14% of EBIT)
S&P Global’s energy division is made up of its legacy Platts benchmarks, licensing and news subscription operations (49% of S&P Global energy revenue) and IHS Markit’s CERA consulting and energy database businesses (51% of S&P Global energy revenue).
As we discussed in our product and industry analysis, Platts has far superior economics relative to CERA due to its proprietary, mission-critical subscription lock-in with customers and having minimal variable costs. The 9-year revenue and EBIT margin chart below further proves this.
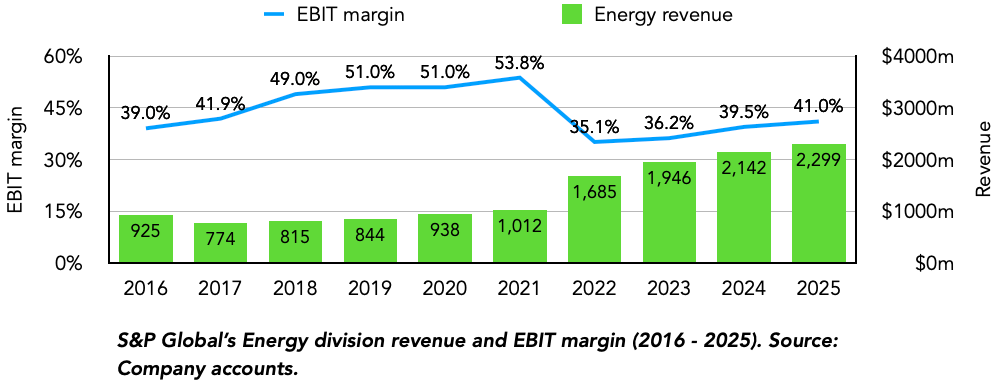
As you see from the chart, prior to the IHS Markit acquisition in 2022, Platts maintained 50%+ margins with commendable margin expansion in the prior years. My research into published Platts contracts with various UK governments reveals the nature and subscription terms of legacy Platts.

The CERA business, while more diversified in revenue streams, is more cyclical, and a key clue to this is the change in share of energy revenue from exploration & production companies between 2021 and 2024, a share that’s increased from 6% to 14% with CERA included (see chart below).
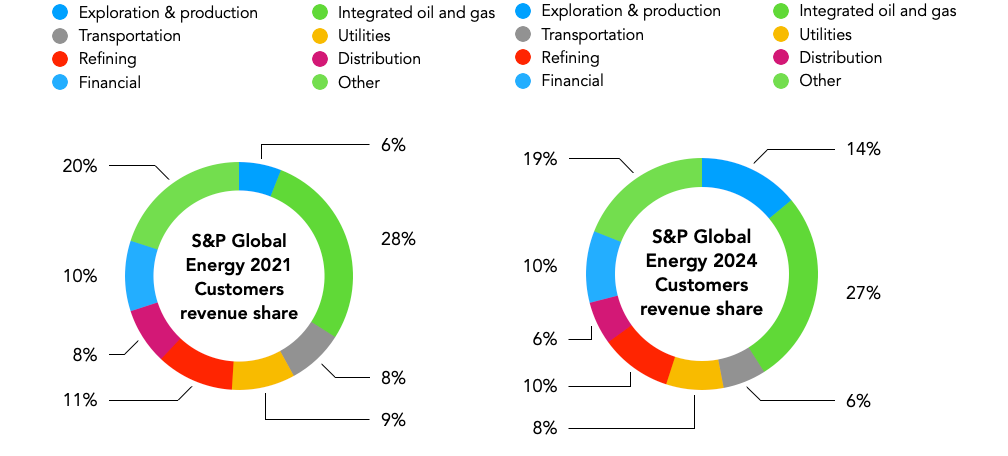
Beyond energy consulting, solutions like upstream data & insights, conferences and market insights are more correlated with energy trends, and I suspect a severe downturn could weigh on its growth prospects.
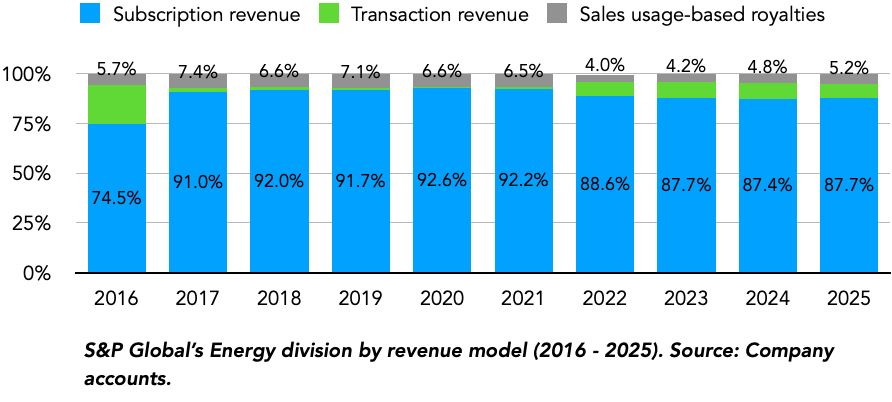
Supporting our analysis is the share of revenue by type and, as shown, transaction revenue (consulting and conferences) increased post-IHS Markit acquisition, but its slower growth profile than energy’s subscription businesses means its share is slowly declining.
Compared to Market Intelligence, the Energy division operates in a more oligopolistic and regulated market and limits the acquisition potential. For future growth, I suspect it’s going to be a mix of pricing power and further cost cutting.
Energy cost structure
There are two cost lines worth highlighting before concluding on why I see room for cost optimisation at the energy division.
Reporters and pricing data specialists: Platts benchmarks are highly tilted towards the data engineers that support newer benchmarks (2026; these include U.S. Gulf Coast and Brazil SAF, European renewable hydrogen, and others). The employee base is quite sticky, as many are specialists with deep IP (relationships and credibility) required for pricing assessments. I see minimal cost optimisation here.
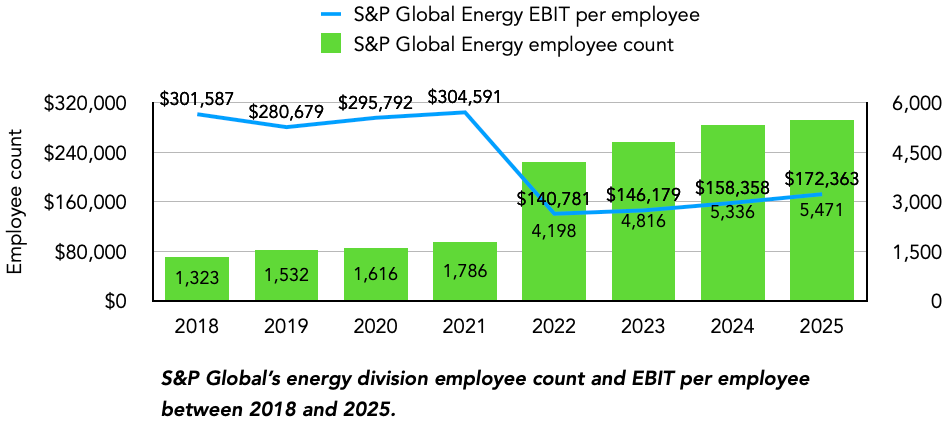
Consultants, upstream specialists and customer experience: As shown in the chart above, the Energy division’s number of employees increased by 135% in 2022 post-IHS Markit integration. While the transfer of Sustainable1 from Market Intelligence to Energy plays some role in the employee count bump in 2024, the overall growth shows there’s an uptick in labour intensity. After reflecting on ongoing efforts to scale CERA Titan, its upstream data analytics tool and increased competition for energy consulting, I suspect these roles play a significant role in Energy’s more bloated cost structure.
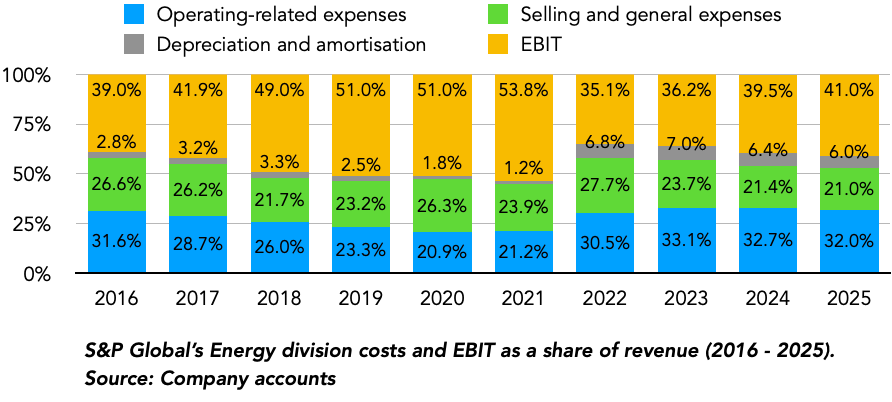
With AI, it’s clear that, over time, these roles will become significantly more cost-efficient and could experience a material increase in EBIT per employee.
From a division margin lens, S&P Global’s efforts with margin expansion are already taking shape, with margins reaching a near-term high of 48.1% in the most recent quarter. In the growth section, I will map out where I believe these margins could reach by 2030.
Ratings (31% of revenue, 46% of EBIT)
Ratings is the crown jewel within S&P Global, and I’ll walk you through the ratings business model to explain why.
There are four customer groups: corporates, financial institutions, structured finance (asset-backed securities, CDOs, etc.), and governments. Each of these four customer groups often seeks ratings to provide their investors and stakeholders with an independent view of their financial state. Research by BDO found that being rated could save an issuer $16.3 million (0.65% lower interest rates) over 5 years for a $500 million bond issuance. Some pension funds and insurance companies are legally barred from buying unrated bonds, and ratings have proven over decades to be helpful for the global debt market.
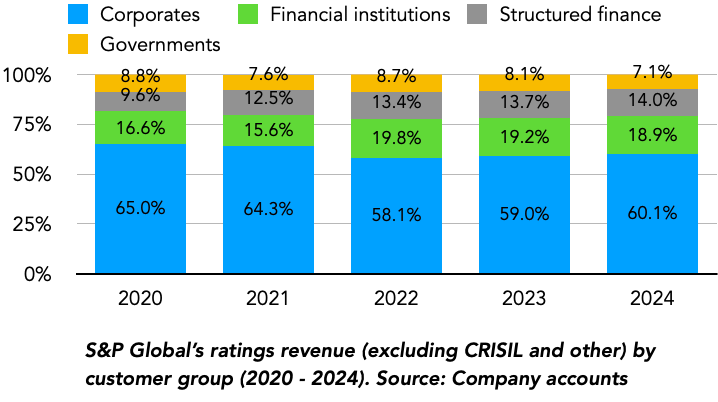
As shown in the chart above, corporates represent the largest share of S&P Global’s revenue. One might assume S&P Global receives the most ratings from corporates, but interestingly, government entities actually receive the most ratings. In 2024, S&P Global government security ratings (904,586) were 16 times more than corporate ratings (55,272), and the reason behind this is pricing.
S&P prices the initial issuance fee as the higher of a set basis points of transaction value or a minimum fee (U.S. corporate 8.35 bp or $155,000), and for governments, the floor pricing is much lower, at a minimum floor of $8,000. This pricing model is important for our ratings growth analysis, as its issuance fee is typically a percentage of the volume, and what that means is ratings is, of course, correlated with the issuance volume.
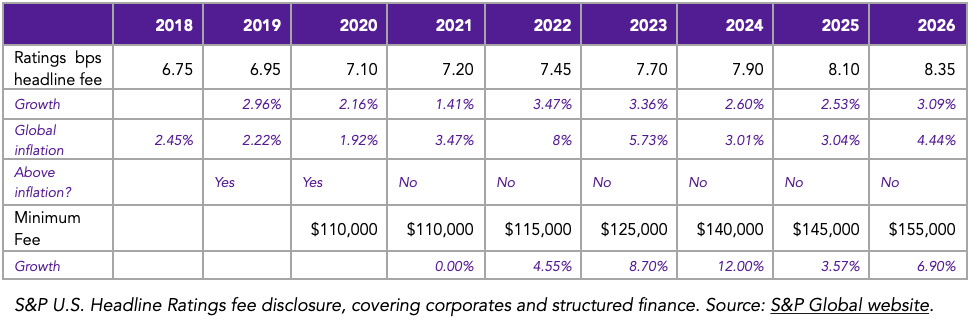
As shown in the table above, the pricing fee has broadly trended upwards, from 6.75 b.p. to 8.35 b.p. over the past 8 years, a 2.7% CAGR. This, combined with the overall growth of corporate debt (see chart below), explains the economics of transaction ratings revenue.
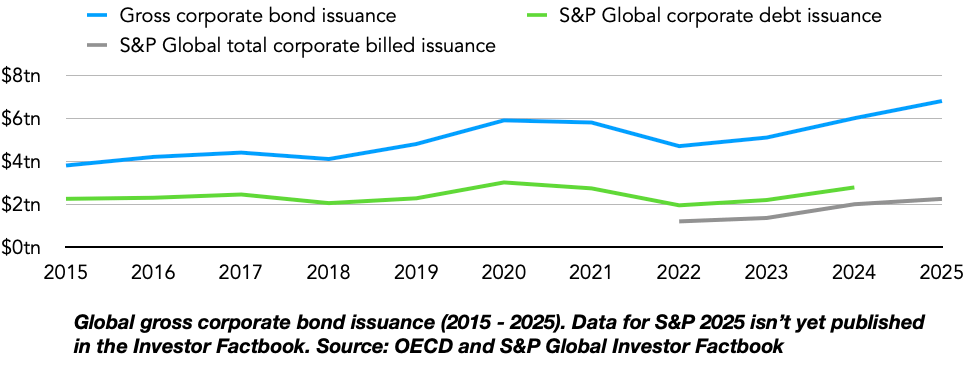
Note: The Chinese economy debt boom seen in recent years led to a loss of global share for all three major ratings agencies. Also, not all debt rated is billed due to the frequent issuer program. After 2022, S&P Global began presenting its billed issuance in its company accounts, and I include this in the ratings valuation model. This is also a limitation when comparing Moody’s and S&P directly.
Non-transaction revenue
The even more lucrative and higher quality segment of ratings is the non-transaction revenue; what happens after the initial one-time issuance rating. Every year for the issuance term length, S&P undertakes ongoing monitoring of the issuer’s creditworthiness and maintains ratings on the borrowing (AAA, Aaa, BBB, etc.).
Several government and public-private organisations publicly share their contracts with S&P, such as Czech Export Bank and the Philippines Development Bank and while this is too small a sample to have any solid conclusions, reading both indicates an initial surveillance fee of around $80,000 with annual increases between 3-6% on average.
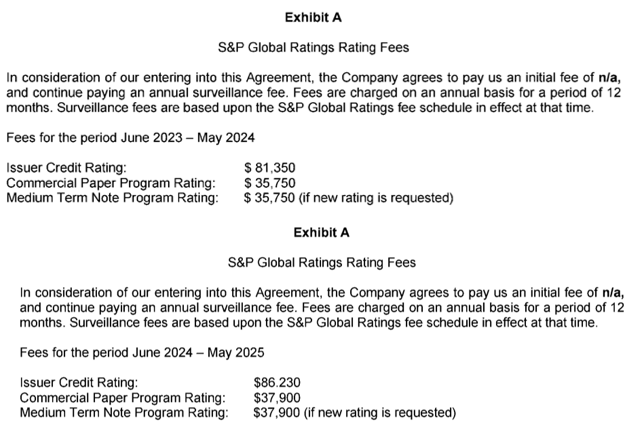
In the Czech Export Bank example above, we can see S&P fees rising 6% from 2024 to 2025. In my opinion, this is an extreme pricing power example and shouldn’t be extrapolated for the future.
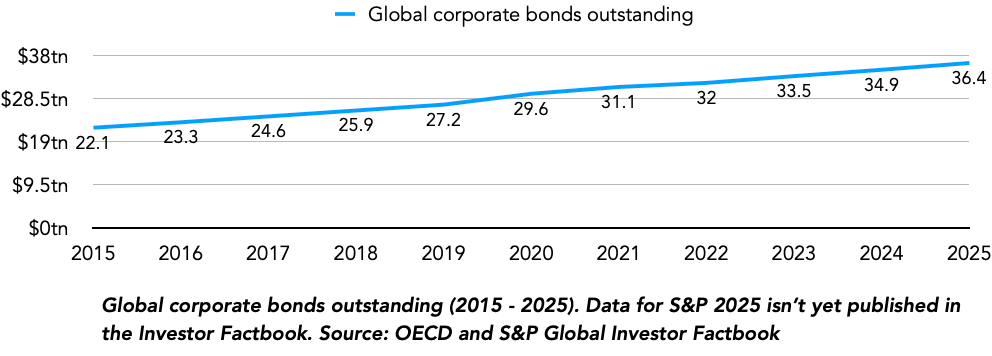
Over the past 10 years, the fairly low interest rates, stable macroeconomic environment with good but cyclical M&A activity, and, more recently, AI-fuelled Capex expansion have led to a 5% annual growth in corporate bonds outstanding, ahead of 3.1% inflation, supporting S&P Global’s pricing power. For the future, we can’t accurately forecast what these variables might look like, and I will take a base case scenario to explore how S&P Global’s transaction and non-transaction revenue might grow in the long term.
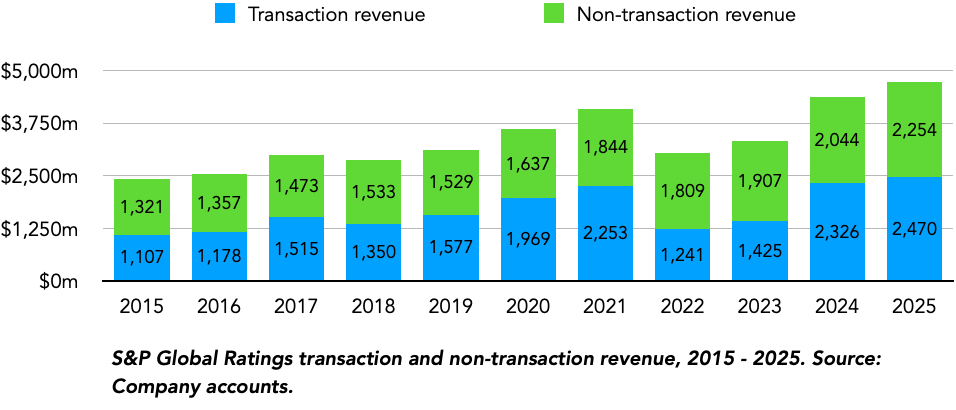
Over the last ten years, S&P Global’s Ratings revenue has grown at a 6.9% CAGR, nearly doubling during the period. As you see on the chart, transaction revenue can be very volatile; it declined by 44% in 2022 and grew by 63% in 2024, which is why I deem it not as high quality as non-transaction revenue.
Note: S&P Global’s Ratings non-transaction revenue includes revenue from ratings subscriptions distributed through Market Intelligence and S&P Global’s portion of CRISIL’s revenue. I explore CRISIL’s valuation in section 10.
S&P Global’s cost structure
Ratings is S&P Global’s second most profitable division, behind Indices, and the key reason for this is the asset-light nature of its business model. While the cost per employee is 16% higher in Ratings than in Market Intelligence, the revenue per employee is more than double in Ratings, $523,145 versus $238,791.
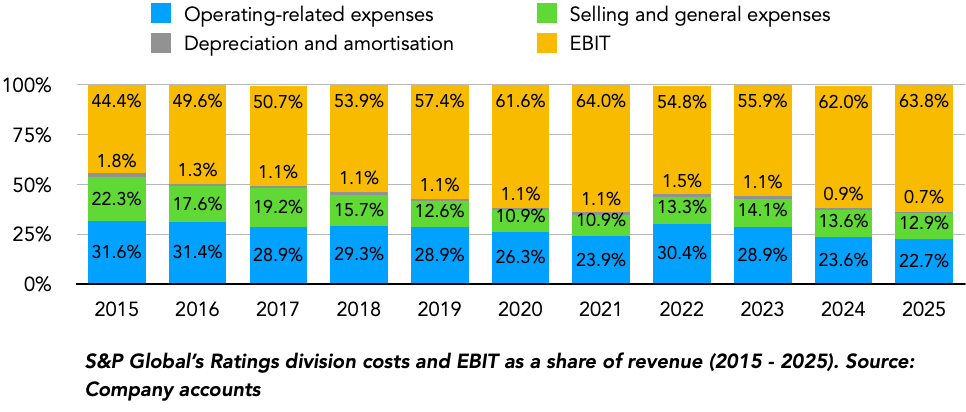
Labour represents a large share of costs, and from the S&P careers website, credit analysts’ remuneration can average $150,000-$200,000 per employee, and given how critical ratings is, there’s a substantially larger compliance infrastructure (and legal) cost base.
AI could lead to a cost efficiency push for ratings, and the career page already reveals some clues:
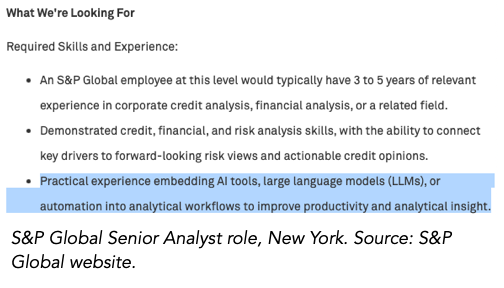
AI supported by the analyst team at CRISIL could drive even more ratings per employee, leaving ratings with additional operating leverage. Of course, technology, cloud and computing costs would also increase, and commentary on this in future quarters should be closely monitored.
This now brings us to S&P Global’s highest margin business, Indices.
Indices (12% of revenue, 19% of EBIT)
S&P Global Indices is split into three revenue areas, each representing an economic model of how S&P monetises its proprietary indices across equities (S&P 500) and the IHS Markit acquired fixed income indices (CDS Index, iBoxx).
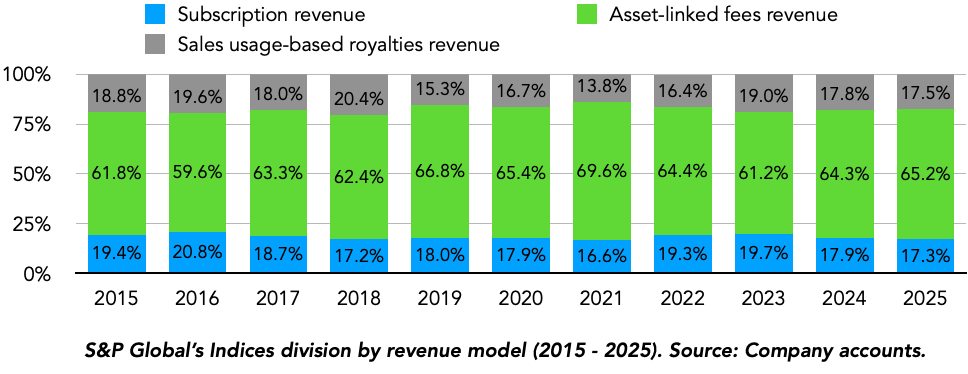
The largest revenue source, asset-linked fees (see chart above), primarily represents revenue generated by ETFs linked to S&P’s indices, the largest of which is the S&P 500, the world’s largest index.
S&P Global reports the average and year-end ETF AUM and splits the growth drivers between price changes of the underlying asset (e.g. S&P 500) and flows, and from these, we gain insights into the business economics, presented in the indices table below.
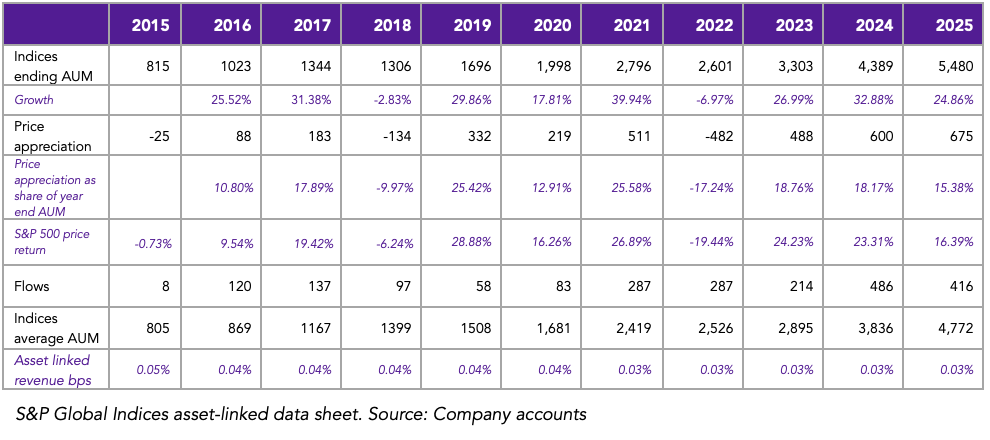
There are some important takeaways worth highlighting:
S&P 500 versus Indices ending AUM: One might have expected indices ending AUM to simply match the S&P 500, but as you see from the table, both values are different, as Indices growth outpaced the S&P 500 return. Several reasons contribute to this. First, new AUM flows and the rise of ETFs (see flows row) are a significant growth lever. Second, 52% of the AUM share is directly linked to the S&P 500, while the rest is linked to other indices or sector and style S&P 500 indices. This adds some pricing diversification.
Flows versus price appreciation: Between 2015 and 2025, flows contributed 47% while price appreciation contributed 53% to the 6.7x ($815 to $5,480 billion) increase in ETF ending AUM between 2015 and 2025.
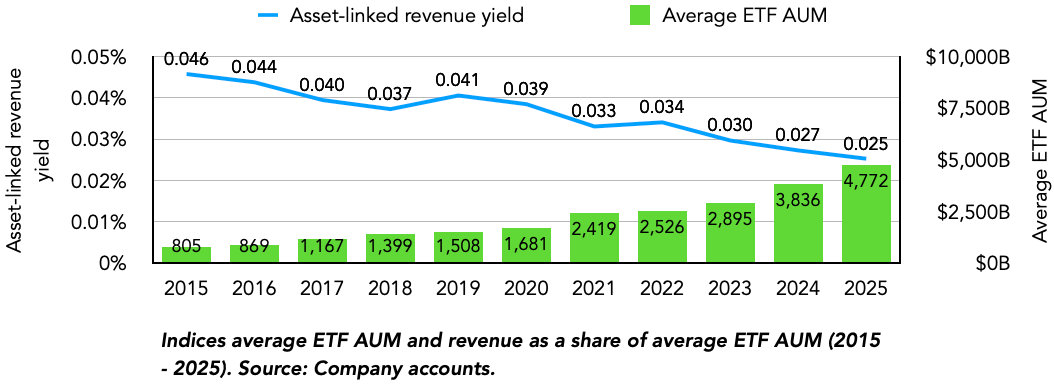
Asset-linked revenue yield: While there are other inputs to the asset-linked, measuring the asset-linked revenue as a share of the ETF AUM (average, not ending) is a good, but far from perfect proxy of indices monetisation and, as shown in the chart, it has trended downwards over the past ten years, from 4.6 basis points to 2.5 basis points, a 45% decline. This doesn’t mean pricing has declined by 45%, though; some S&P 500 ETFs still hold their 3.0 basis points + $600,000 fee structure; it more highlights how newer products and IHS Markit assets don’t match the core S&P 500 pricing power.
Beyond asset-linked revenue, we have subscriptions (17% of revenue), which represent income from asset managers who pay to access index data to manage attributions and measure their performance. Compared to asset-linked revenue, it’s slower growing but has a stronger lock-in. During market drawdowns, its revenue tends to be more stable than ETFs given the subscription format.
The final segment is the sales usage-based royalty revenue, which refers to revenue generated from licenses with CME Group (60% share) and Cboe and others (40% share) for their use of S&P-linked indexes in derivatives (CME Group) and index-options contracts (Cboe). The interesting thing here is that its volume and thus royalty revenue increases during volatile drawdowns and somewhat counterbalances declines in the asset-linked revenue, serving somewhat as a natural hedge.
These three divisions have led to one of the most impressive and high-margin financial infrastructure divisions of all time, compounding its growth by 12% at 65-69% EBIT margins.
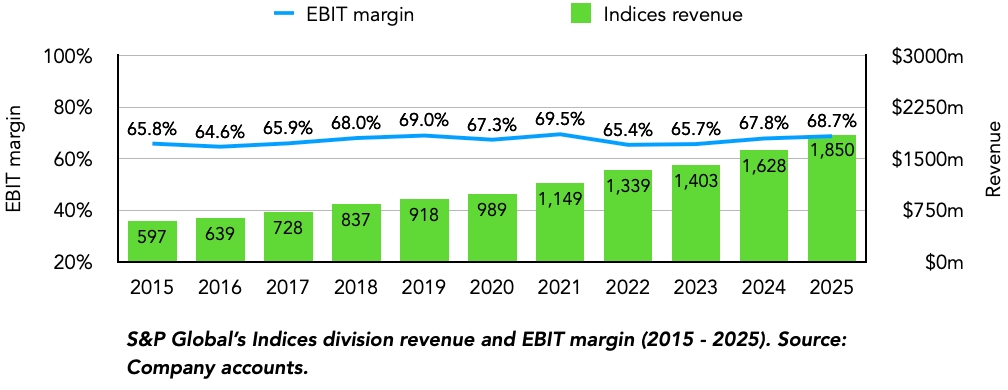
Indices cost structure
Note: Indices is 73% owned by S&P Global and 27% owned by CME Group, meaning there’s some minority interest in its earnings.
On a per-employee basis, Indices is by far the most profitable division, with its 1,153 employees achieving an EBIT of $1.1 million per employee, three times higher than Ratings. The benchmark and minimal variable costs contribute to this. Beyond market data, cloud hosting and technology, and benchmark governance services, there isn’t any other significant cost for indices.
I believe the cost base could remain stable in the mid-term, and I don’t anticipate much change going forward.
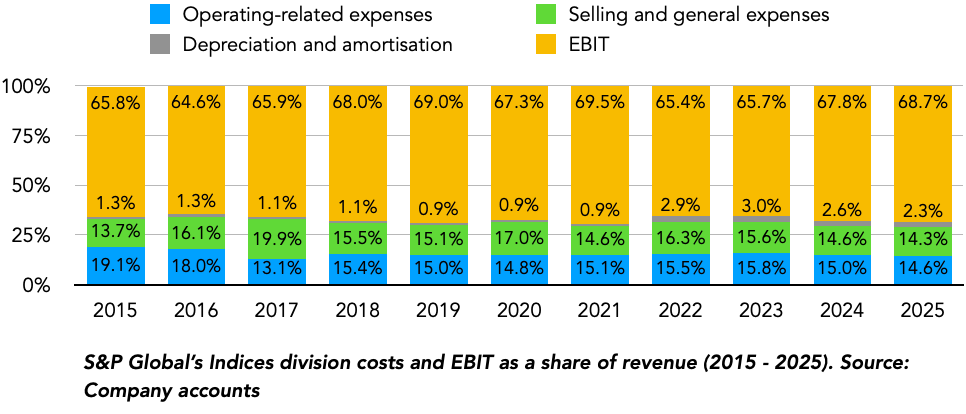
To put all four divisions into context and assess how customers pay and their attributable variable costs, I will next discuss my unit economics analyses using BlackRock, the world’s largest asset manager, as our example.
S&P Global’s unit economics analysis (BlackRock)
You can access the full S&P Global unit economics sheet here.
The purpose of the unit economics calculations isn’t to estimate with precision what BlackRock represents of S&P Global’s economics. The purpose is to show what S&P Global’s economics on a customer contribution margin might look like, each product’s customer lock-in, and how the economics change with changes to the underlying user (Market Intelligence and Energy) and volume (Indices and Ratings).
Market Intelligence unit economics
For simplicity, I segment BlackRock’s Market Intelligence needs into two parts: Capital IQ and enterprise solutions, which represent a mix of lending solutions, pricing and valuation and managed services. In reality, S&P Global’s Market Intelligence division and BlackRock likely have separate enterprise agreements for With Intelligence, Compustat and iLevel.
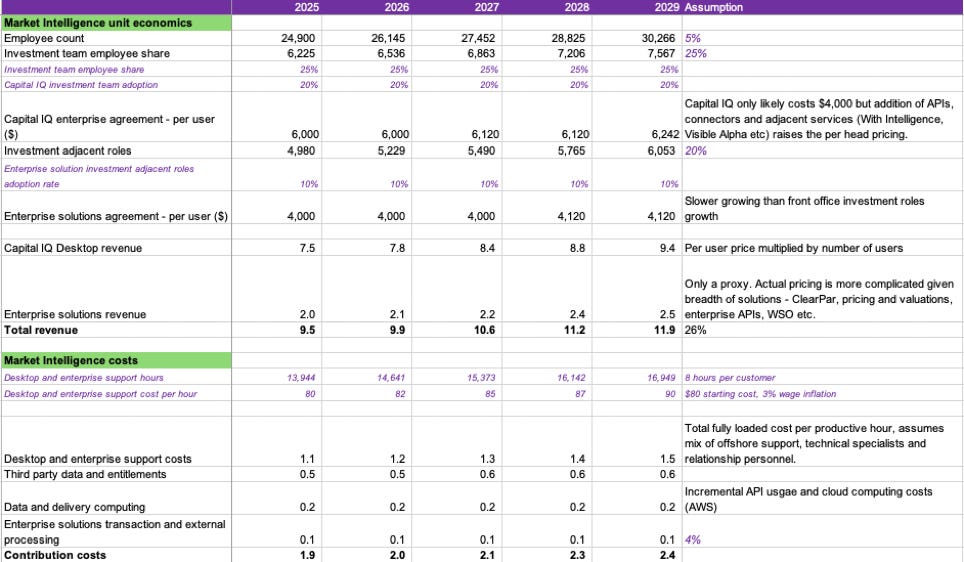
You can access the Market Intelligence unit economics sheet here.
Variables: BlackRock’s investment team (Capital IQ) and investment-adjacent roles (enterprise solutions) employee base and their adoption rate are the key variables. BlackRock likely has an enterprise agreement, and as a guide for what that pricing looks like, I use the publicly available UK Government Market Intelligence pricing plans.
Revenue and costs: Factoring in BlackRock’s ownership of tools like Preqin, eFront and Aladdin, BlackRock’s enterprise adoption is likely lower than peers, especially for enterprise solutions. A 20% adoption rate for Capital IQ and a 10% adoption rate for enterprise solutions lead to an annual revenue of $9.5 million, with a 5.8% long-term growth rate to 2029. On the cost base, we have four contribution costs, the largest of which is desktop and enterprise support costs. I estimate each user requires, on average, 8 hours of support at $80 per hour, along with the three other cost lines, for a contribution cost of $1.9 million.
Profitability and analysis: Although Market Intelligence’s contribution margin of 80.3% is higher than other businesses we have studied, it has the lowest contribution margin among the S&P Global businesses, and when coupled with the presence of direct substitutes, it ranks the least in our division quality score.
Energy
Global Infrastructure Partners, a private equity company owned by BlackRock, as well as active equities teams like their natural resources and climate transition teams, are likely customers of S&P Global energy. I split the energy unit economics into Platts (per user subscriptions) and CERA (consulting and analytics).
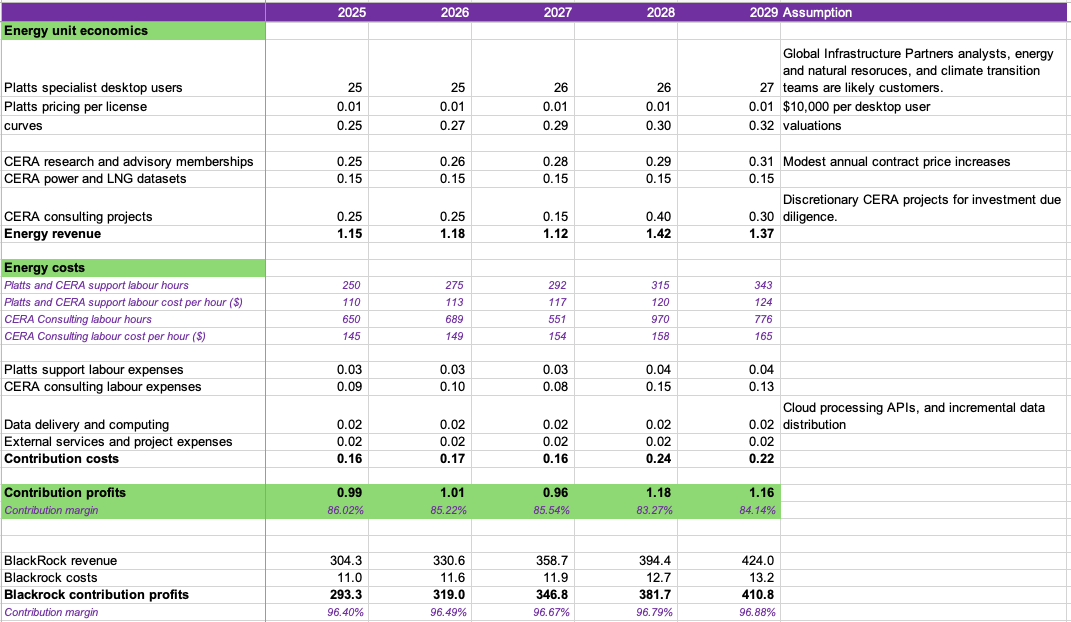
Variables: For Platts, I estimate there are 25 specialist desktop users, averaging $10,000 per user, while CERA has a mix of consulting, power and LNG and advisory memberships.
Revenue and costs: While Platts is sticky, asset managers aren’t the core user base, which means the revenue generated from S&P Energy is quite small, at just $1.15 million, growing 4.5% annually. Similar to Market Intelligence, Platts support labour expenses are a key cost line. However, the more significant cost line is CERA consultants supporting consulting and advisory work. Altogether, this brings the energy contribution costs to $160,000, an 86% contribution margin.
Profitability and analysis: Compared to Market Intelligence, Energy has a higher contribution margin at 86%. The challenge, though, is that the profits generated are so small: 13% of Market Intelligence. I believe this reaffirms the breadth of S&P Global’s customer base.
Ratings
While corporate bond ratings are the most lucrative and largest ratings product, diversified asset managers like BlackRock are likely to generate more revenue from structured finance products at its private credit fund, HPS. For the unit economics, I estimate that BlackRock issues debt in 3 of 5 years; all of its corporate debt is S&P-rated, and the HPS structured finance ratings are cyclical.
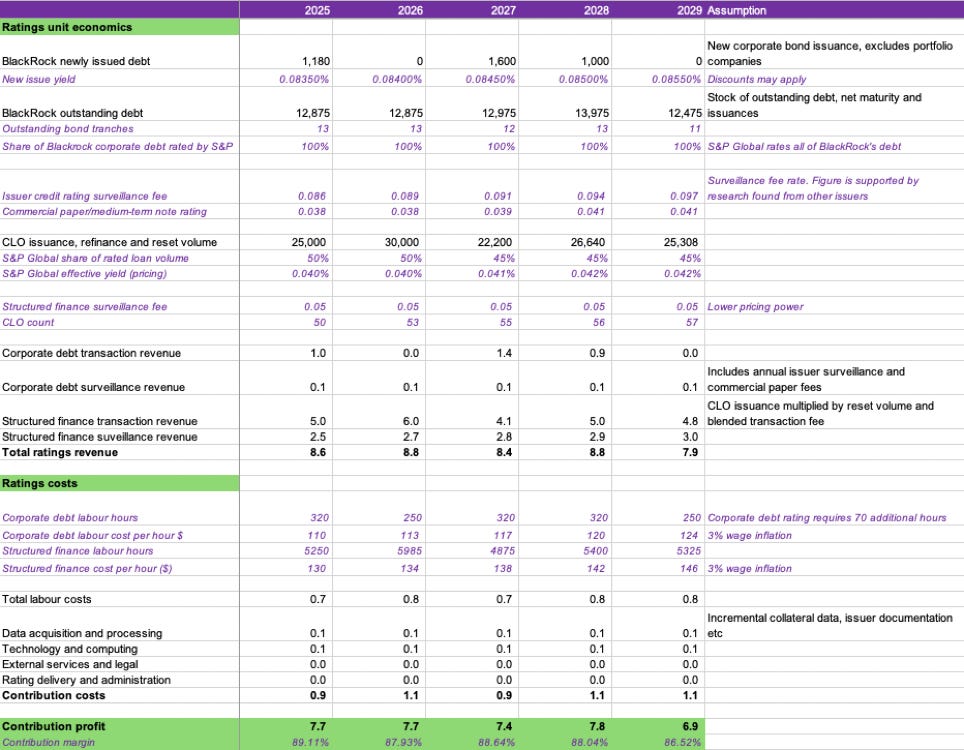
Variables: Corporate debt incurs an issuer fee yield of 8.35-8.55 basis points between 2025 and 2029, while the CLO issuance, refinance and reset annual volumes yield half of corporate bond revenue yield.
Revenue and costs: While transaction revenue represents a larger share of BlackRock’s revenue, we can see how non-transaction revenue brings stability to ratings revenue, estimated at $8.6 million in 2025. Structured finance products are also less profitable due to the higher labour cost rate ($130 versus $110) and the more hours required per rating. Overall, this leads to a contribution cost of $0.9 million.
Profitability and analysis: Surprisingly, ratings profitability is on par with energy, but if we exclude the structured finance business, corporate ratings is on par with the other high-margin S&P Global businesses. From the unit economics, we can see why S&P Global willingly declined its structured finance business, focusing on corporate and sovereign debt.
Indices
With $14 trillion in AUM and $6.5 trillion in ETFs, BlackRock’s iShares is a significant customer for indices, alongside State Street and Vanguard. For simplicity, I divide S&P Global’s revenue into ETF and non-ETF (subscription and others) and estimate a 14-15% share of BlackRock’s AUM linked to S&P Indices.
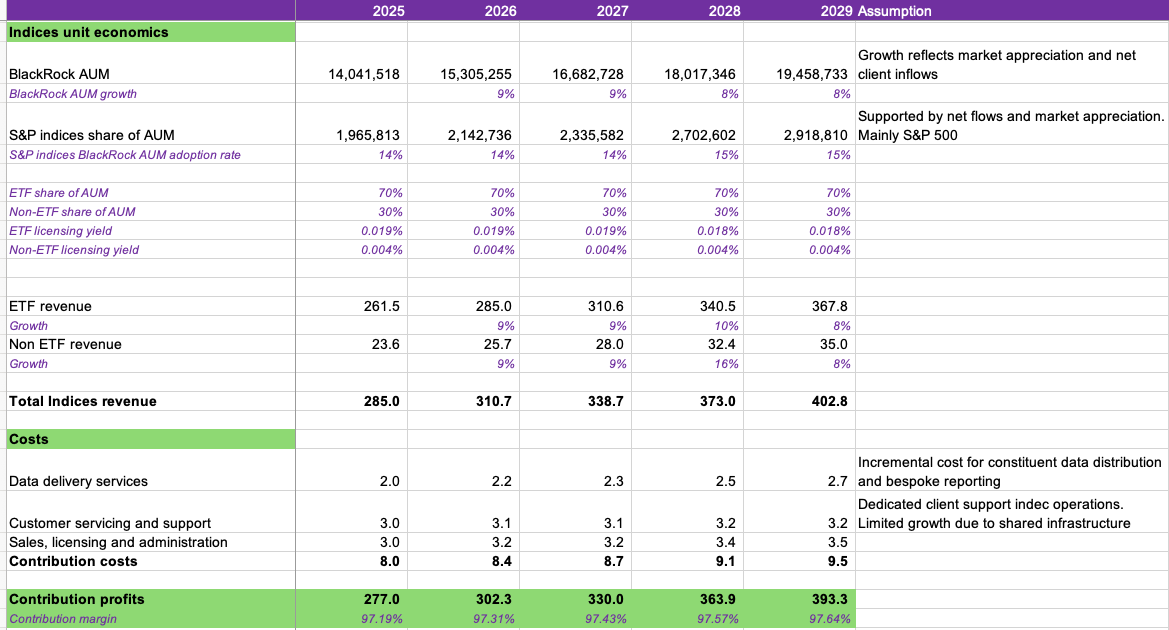
Variables: Beyond the adoption rate, the ETF licensing yield is a key driver of revenue, and here, I estimate 1.9 basis points.
Revenue and costs: 90% of BlackRock’s S&P Indices revenue comes from ETF-linked revenue, and in total, I assume $285 million in revenue. Indices’ cost base is the asset-lightest, roughly a 2.8% cost margin, leading to $8 million in contribution costs. The cost base is broadly split between the three cost lines.
Profitability and analysis: Indices is by far the most profitable division on a pure contribution profit lens. An issue, though, is that S&P Global doesn’t own all of Indices, and 27% of the profits flow to CME Group, which reduces the contribution margin to shareholders. This profitability margin, while great, also highlights the supply chain concentration for Indices; I estimate that 15% of Indices revenue comes from BlackRock alone. This slightly hurts the division’s quality score at Indices.
The unit economics analysis reconfirms the view of S&P Global being a high quality company by mapping out its profitability and customer diversification (excluding indices). For the valuation equation, this means paying a high multiple is partially justified. That leaves growth and overall risks, which I explore next.
7. S&P Global’s growth potential
Objectives: Estimate S&P Global’s revenue and cost potential for each division, with corporate overheads included, between 2025 and 2030.
Between 2025 and 2030, I believe S&P Global can grow its revenue at a 5.1% CAGR, while its EBIT could grow at an 8.7% CAGR. The valuation model (see here) explicitly maps out its potential path to achieving these, and in this section, I’ll discuss the drivers behind its potential growth in each of the four divisions.
Note: I make several macro estimates such as global GDP growth, outstanding corporate debt, S&P 500 potential performance and a few others in my model. These numbers simply reflect consensus, and the focus here is understanding how these might affect S&P Global’s financials.
For each division, I’ll also mention what could break our growth assumptions, setting up for a risks discussion.
Energy (5-year 7.7% revenue and 11.3% EBIT CAGR)
Note: Journal of Commerce and Maritime & Trade were reclassified to Energy from Market Intelligence in H1 2026. The reclassification increases 2026 financials and shouldn’t be treated as organic growth.
Overall, I expect Energy to be the slowest-growing division over the next five years, with the main focus on improved cost efficiencies. Beyond the reclassification, the energy division’s growth drivers are centred on three areas:
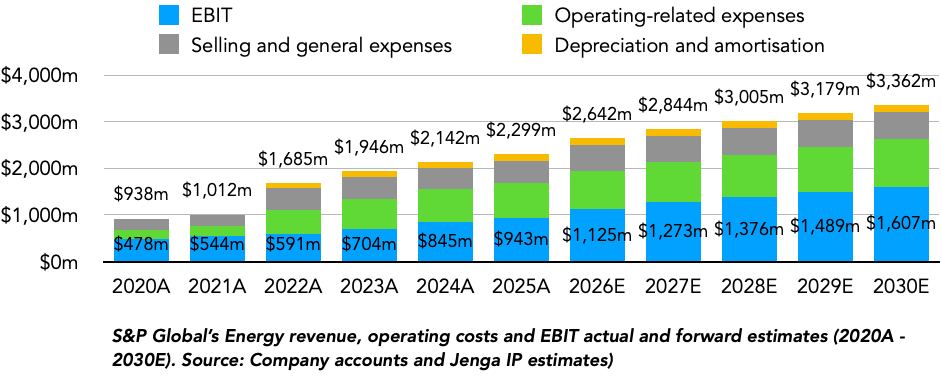
Product strength: Platts Market Data integration directly to risk teams and connection through APIs with data warehouses and MCPs is increasingly becoming a source of product strength improvement. I still see lots of ways Platts can build on its momentum here. Good examples of this are Deepak Phenolics, which integrated Platts with SAP and their Microsoft CRM, eliminating manual labour tasks, and Closelink, whose customers can now directly access fuel prices without having to manually check them. Altogether, I believe these product developments could provide an annual 1-2% pricing power strength for Platts.
CERA acquisitions: Given the already concentrated market structure among PRAs, I believe there is minimal direct acquisition opportunities for Platts. CERA, on the other hand, still has substantial acquisition potential. Electricity pricing, LNG intelligence and data centre analytics are three end-markets that offer CERA acquisitive growth prospects, both from direct specialist advisory businesses to intelligence and data analytics. The acquisition of dataCenterHawk last quarter is a good case study of the opportunity here. S&P Global, through its 451 Research team, had already begun tracking the data centre market, but the acquisition of dataCenterHawk adds a robust dataset base, and its offering here can easily be bundled with other tools like CERA Power.
Energy security and volatility: In the last four years, we have experienced large oil and gas price swings, geopolitical uncertainty and electricity price inflation. While S&P Global Energy isn’t necessarily correlated with the end market, customers facing much higher uncertainty lead to a natural increase in pricing and real-time information and Platts datasets (as well as CERA’s advisory business) become more valuable for customers. Even though these factors might not lead to growth, they increase the staying power and retention rates for existing customers.
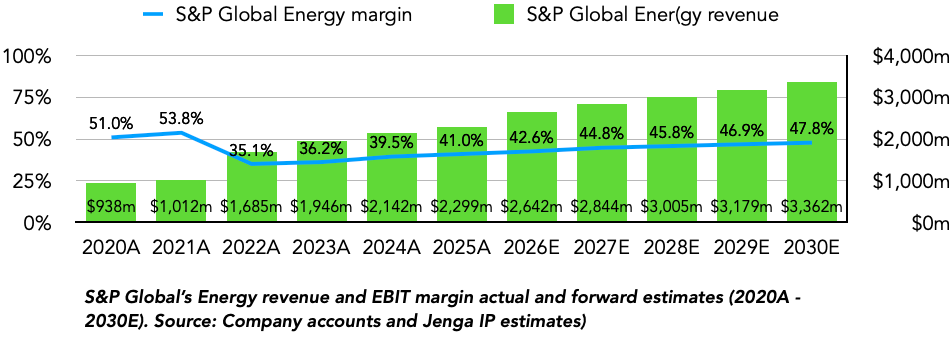
From the chart above, you might notice I anticipate some operating margin improvement over the next few years. This is two-fold. First, on the non-cash aspect, is CERA’s amortisation schedule. The IHS Markit acquisition negatively impacted the division’s profitability, and as the merger’s amortisation reduces as a share of revenue, we could see some operating leverage. Second, I believe AI could improve productivity at CERA’s research and consulting teams and in data collection and processing automation. Altogether, these could bring Energy to a 47.8% EBIT margin business by 2030.
What breaks the growth assumptions: Compared to Market Intelligence, AI is less of a risk for Energy due to Platts datasets, and the subscription base also makes it more resilient than Indices and Ratings to economic shocks. I’m more concerned if CERA fails to capitalise on cross-selling opportunities with Platts or falls behind specialist peers like Wood Mackenzie.
Market Intelligence (5-year 6.5% revenue and 14.6% EBIT CAGR)
While Market Intelligence growth prospects and resilience are currently doubted by markets, I still value both Kensho Data & Platforms and Enterprise Solutions as two high-quality sub-divisions. My growth estimate assumes management keeps the Kensho Data & Platforms perimeter. Overall, the division’s prospects rest on three factors:
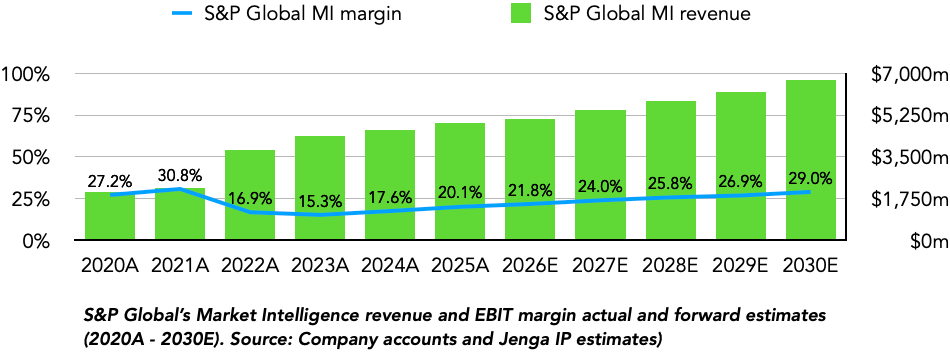
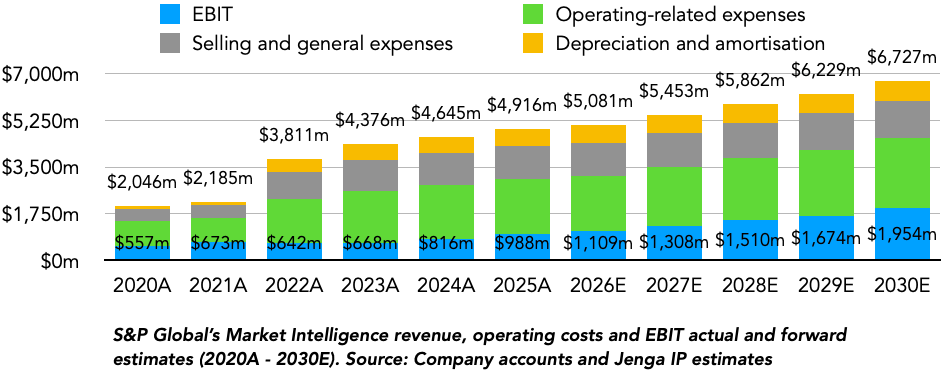
Kensho’s potential acquisitions: No other sub-division at S&P Global offers the group as much acquisition potential as Kensho (although at a high price). Recent acquisitions of Visible Alpha and With Intelligence added over $200 million to Kensho’s revenue, and from both, it’s clear what areas management is prioritising: proprietary data and private market tools. In the latter, while Moody’s has undoubtedly built a better and more diversified private market business, I still see potential for them to catch up some lost share. Gain.ai (formerly Gain.Pro) is a potential acquisition target that could fit alongside With Intelligence. Other potential targets include FinDox, 9Fin, CEPRES and Dakota.
End user and AI opportunity: As we discussed in the product overview, Market Intelligence has led its peers in the transition from per-user economics to enterprise-wide economics. What this does is ease the transition and reduce barriers for API and MCP adoption across Market Intelligence clients. Management already flagged that 0.5 percentage points of growth came directly from AI products, and I think Market Intelligence is broadly in a great position to monetise the AI revenue streams, from MCPs to improved connectors to clients’ workflows, for both Kensho and Enterprise Solutions tools. In my view, these could lead to direct ARPU growth for Market Intelligence, and I attribute 1-1.5% growth from 2027 to 2030.
Product strength: In the product analysis (section 2), I discussed the product strength, customer stickiness and scope for integration across the Lending Solutions (Wall Street Office, DebtDomain and ClearPar), Pricing and Valuation tools (PEVals, Totem), among others. The mission-critical and workflow-integrated positions present a natural pricing power for these enterprise solutions, and I expect enterprise solutions pricing to grow by at least 2% per year from pricing alone.
Like Energy, Market Intelligence’s cost structure is bloated due to the amortised IHS Markit enterprise solution assets and complex pricing, sales and employee structure. There are ongoing efforts to simplify Market Intelligence, and given its track record of delivering cost simplification initiatives well ahead of schedule, I expect to see incremental growth here, leading to an EBIT margin of 29% by 2030.
What breaks the growth assumptions: Kensho’s sale at a low price breaks the growth assumptions. There are also AI risks for Market Intelligence, and potential acquisitions might not make up for seat loss revenue decline.
Ratings (5-year 6.3% revenue and 7.3% EBIT CAGR)
Moat wise, Ratings is S&P Global’s strongest business. However, its shortcomings are evident in its growth potential. Ratings is a function of four variables:
GDP growth, lower interest rates, and macro stability: Drive investments, M&A, refinancing, and Capex needs for companies.
Existing outstanding debt: Directly correlated with surveillance and rating evaluation services demand.
Bond market penetration: Deeper bond markets support structured finance volume.
Pricing: Pricing power supports ratings growth.
Excluding the pricing power variable, the other three are highly cyclical and exposed to external shocks, which admittedly makes any forecasts for Ratings simply guesswork. As shown in the model, I’ve used current consensus estimates for these variables to portray what Ratings revenue and economics could look like through 2030 under these conditions.
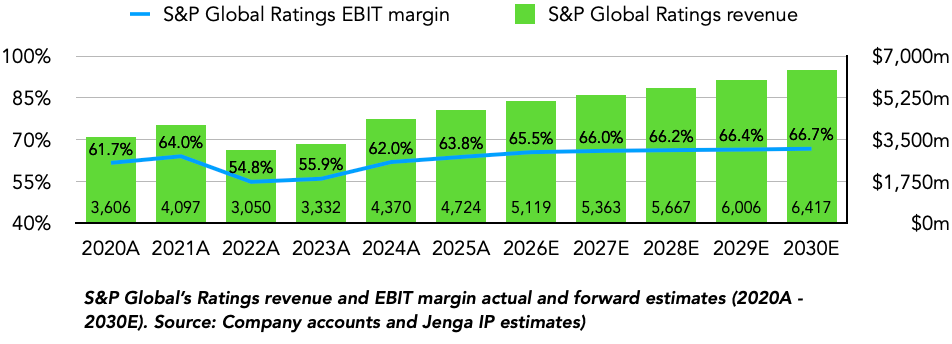
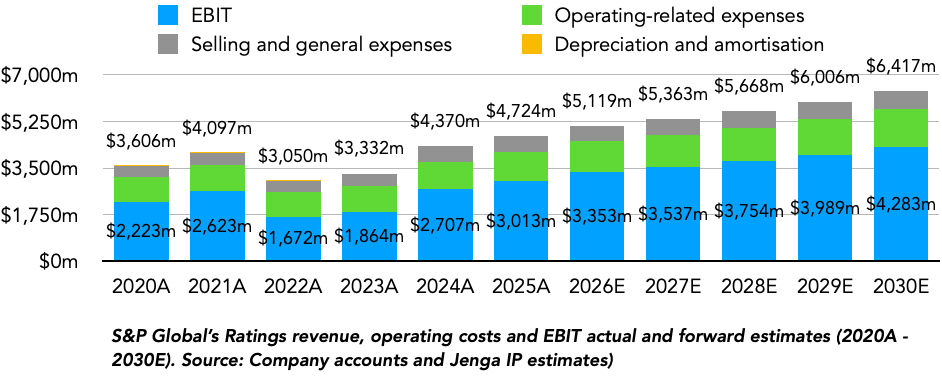
There are several factors that could lead to even faster growth for ratings. AI and hyperscaler Capex needs are a primary factor here. For the three quarters of 2026, hyperscaler debt issuance more than doubled to $240 billion, representing 6.4% of billed issuance or 14% of investment-grade issuance, nearly 36% of 2026 growth.
While there is no back data to support this, I suspect global issuance has never been as concentrated on five companies as we see today. This poses an immediate risk, and while I don’t have a strong opinion on how AI and hyperscaler issuance might grow years out, I suspect the pace seen in 2026 is unsustainable and factor this into the Ratings transaction model.
The more stable and predictable aspect of ratings is the surveillance revenue, and here, I see supportive growth drivers.
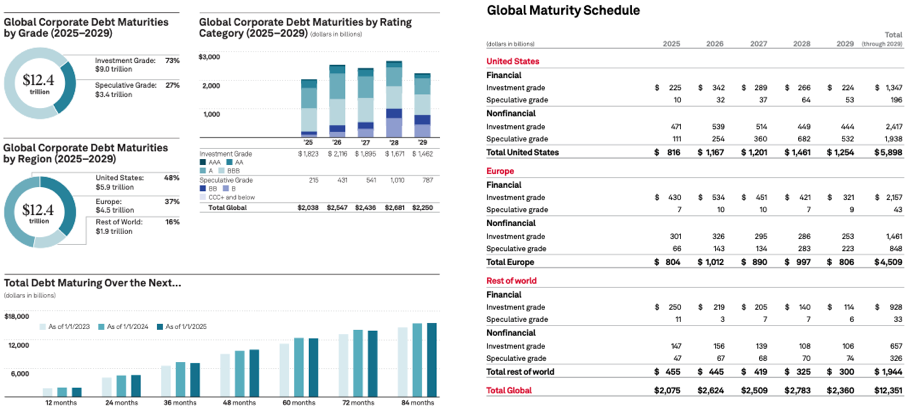
From data published by S&P Global, there’s $10.2 trillion in corporate debt maturing between 2026 and 2029, and $25.7 trillion in global outstanding stock, consistently increasing by 4.4% annually over the last 7 years. Synthesising this with the state of the broader economic environment, I do think this growth rate could be maintained for the next five years. For margin of safety, I reduce the debt stock estimate by 1%.
This brings us to pricing power, and to calculate this, I compare the transaction revenue to my billed issuance projections and non-transaction revenue to global debt outstanding.
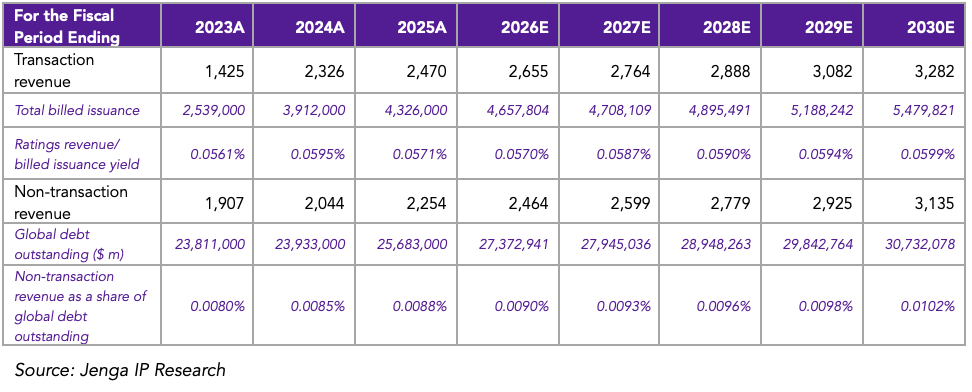
As shown in the table, I believe S&P Global’s market position should still support pricing power for the future, with transaction revenue prices increasing 1% per year while surveillance fees increase around 3% annually.
Unlike Energy and Market Intelligence, I don’t expect substantial uplift from cost savings, leading to an EBIT margin of 66.7% by 2030.
What breaks the growth assumptions: As mentioned, a worse macroeconomic environment and a significant slowdown with AI will immediately hurt growth prospects for Ratings transaction revenue. For 2026 to 2030, I project a 5.5% CAGR in transaction revenue and believe this provides a margin of safety for potential macro risks.
Indices (5-year 13.4% and 14.8% EBIT CAGR)
Indices is S&P Global’s fastest-growing and most profitable division, and I expect its position within S&P Global to hold, albeit at a slower growth pace after 2026. Like Ratings, macro factors impact Indices’ prospects, and we can see its core business drivers as four quantifiable variables:
The S&P 500 Index performance: Although S&P Indices hosts other indexes, the S&P 500 represents more than half of its asset-linked volume and between 2020 and 2025, market appreciation represented 53% of all ETF volume growth between 2020 and 2025, having a substantial part of Indices revenue growth.
Market volatility and ETD demand: S&P 500 ETDs generate a royalty fee for indices, and during periods of heightened market volatility, demand for these products increases, providing some hedge against a market decline in revenue.
Index funds market share growth: The rise of index funds directly impacts the new flows segment of ETF volume growth (47% of volume growth between 2020 and 2025), and factors such as index prices, customer awareness and active manager performance will continually drive this.
Pricing power and monetisation: Pricing and monetisation range across the Indices assets, with factor and thematic indices earning a higher margin, while the S&P 500 index is at the lower end of the margin spectrum for the Indices division.
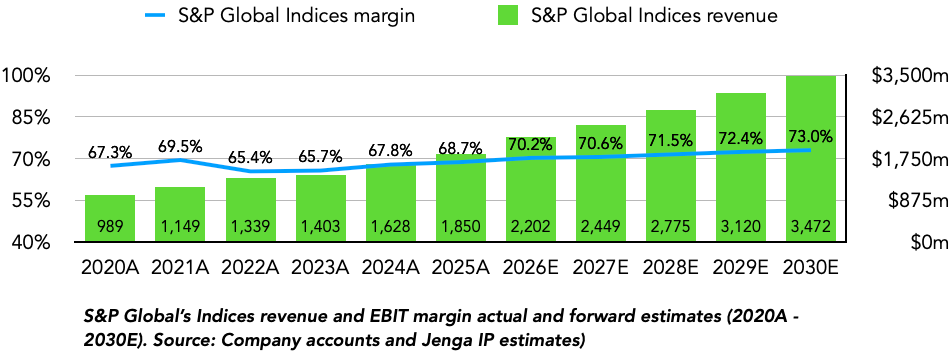
As highlighted in the chart above, I expect S&P Indices to reach $3.47 billion in revenue by 2030, and several factors drive this. First, my base case of the S&P 500 returning 9% over the long term serves as an immediate growth driver for asset-linked revenue. The second half of volume growth is new flows, and several factors support my growth estimates here.
First, in wealth management and pension funds, customisation is increasingly playing an important role here, with custom, thematic and factor-based indices supporting clients in achieving goals better. Second, education also plays an important role, and ETFs serve as a low-cost and easy-to-understand alternative to cash for millions of employed individuals and savers.
I anticipate both factors will drive S&P Indices year-end ETF AUM to $12 trillion, a 17% CAGR, and the table below highlights how these trickle down to my asset-linked revenue, a segment that represents 65% of the division’s revenue.
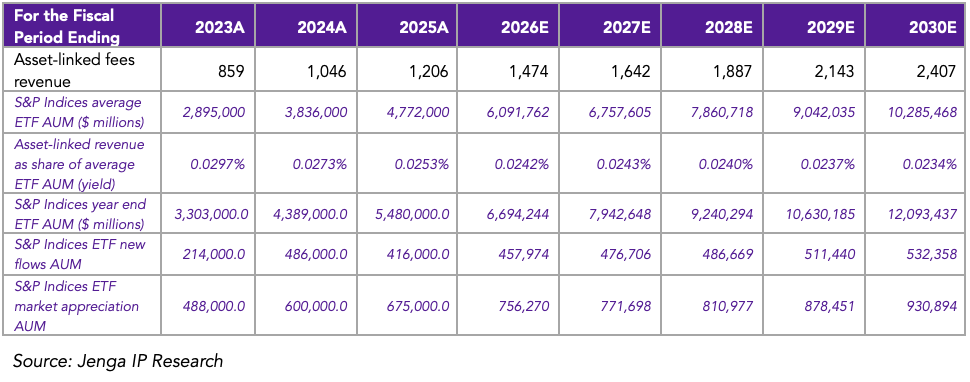
An issue for S&P indices, and the rest of the industry, is that, unlike Ratings, the drive for lower fees will hurt their pricing power, leading to a lower revenue yield (see chart). Note that the revenue-to-AUM yield isn’t an accurate reflection of S&P Indices real pricing because asset-linked revenue also includes non-ETF revenue (mutual funds, SMAs, insurance products).
On the cost side, I expect “business as usual” for Indices with no material changes to its cost structure, leading to some operating leverage to 2030.
What breaks the growth assumptions: Some might argue that current market valuations and euphoria could lead to much less than a 9% annual return for the S&P 500. Poor index returns could have ripple effects, with a reversal of new flows (net outflow). This situation should, however, lead to some growth in royalty revenue from derivative-linked volumes.
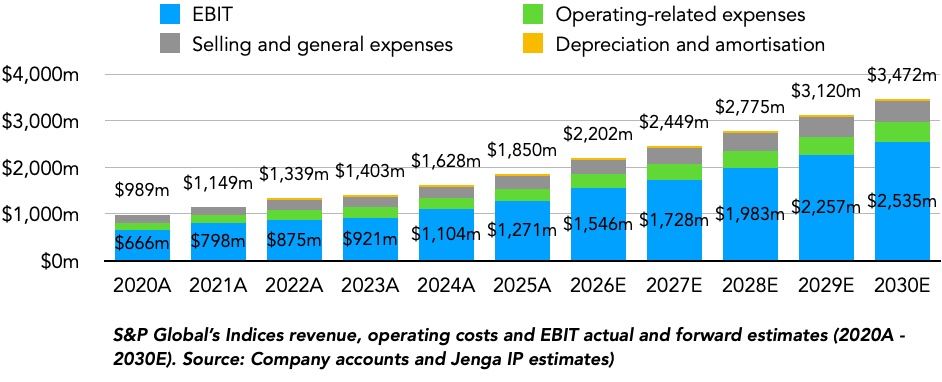
With my growth estimates for each division, I will next assess other risks S&P Global faces before concluding on the valuation model.
8. S&P Global’s Risks
A theme I’ve discussed throughout the S&P Global deep dive is its high quality, and we assessed this across multiple lenses: products, industry and business economics. As a reality check on the earnings multiples I’d pay for its shares, I employ the Jenga IP Quality and risk score system.
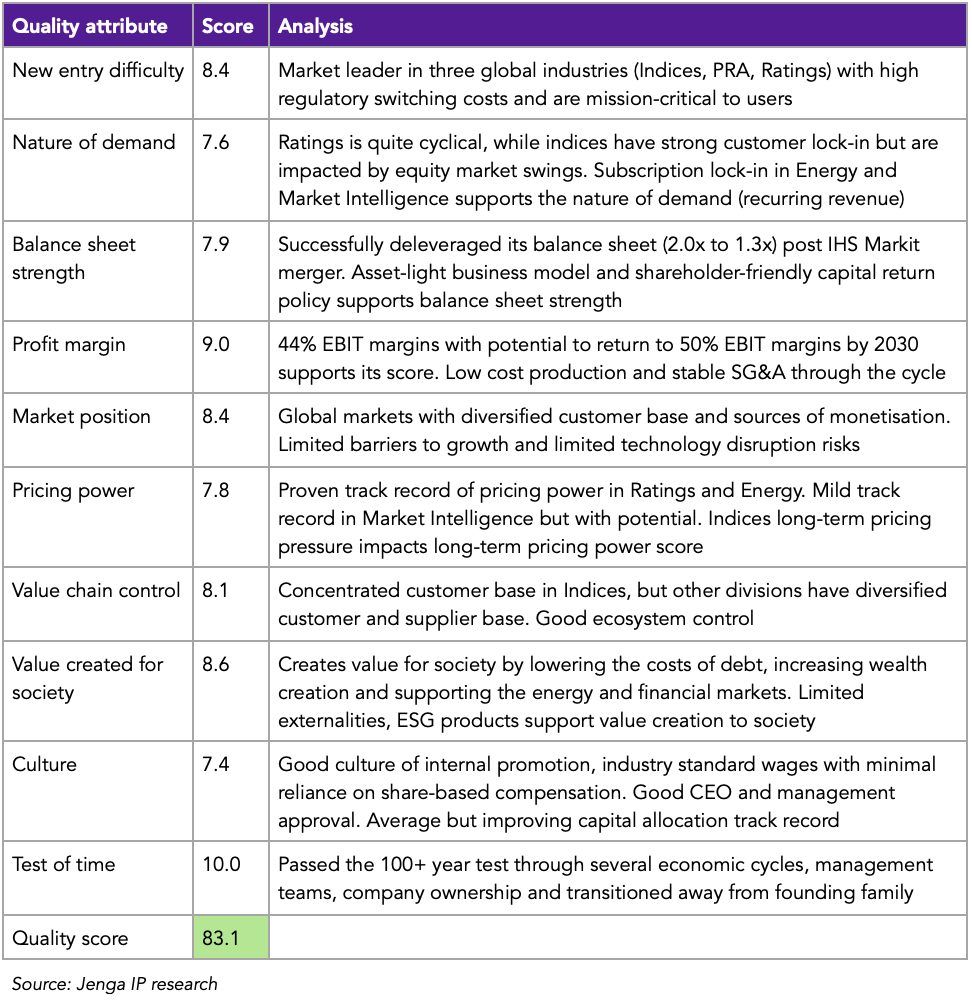
As shown in the table above, S&P Global scores favourably across each quality category, with a total score of 83.1 out of 100, the fourth highest among all companies to date. Even more attractive is its performance on the Jenga IP Risk score, where it has the lowest risk score among all our companies, with just 4 flagged risks.
Let’s explore these risks and how they impact our valuation thesis.
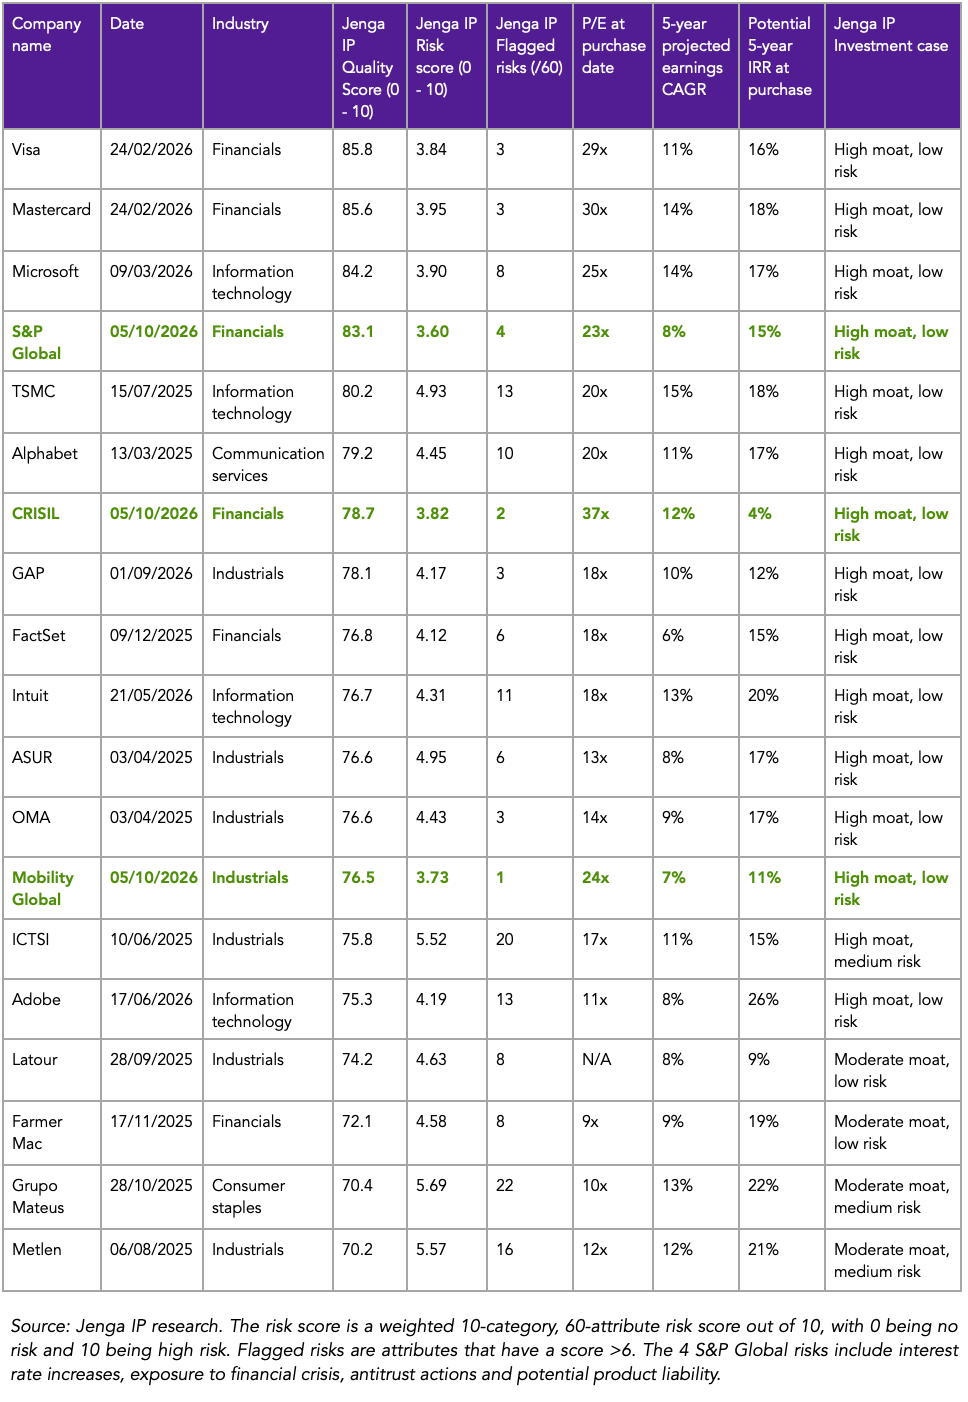
S&P Global’s risks
Financial crisis exposure: In Section 1, reviewing S&P Global’s history, I reviewed S&P Global’s role in the financial crisis and how the downturn impacted its fundamentals. Although every financial crisis is different, the impact of any crisis on S&P Global’s fundamentals is quite clear: demand for ratings falls, index asset-linked revenue declines, and Market Intelligence could see slower transaction volume growth with enterprise agreement churn.
Generally, I prefer not to invest in companies as sensitive to the macroeconomic situation, which begs the question of why still hold S&P Global? Diversification, natural hedge and profitability at its worst. The scale of its ETD businesses within indices, the balance between transaction and non-transaction revenue and the sheer profitability of its unit economics, as we calculated in our business economics case study, proves that S&P Global can still withstand macroeconomic shocks.
How I account for this risk: First, I decreased S&P Global’s exit multiple from 30x P/E to 28x P/E. I also take a base case and a through-the-cycle approach by modelling its earnings growth potential. For example, while S&P Indices market appreciation could turn out higher than 9%, I believe 9% best captures potential downturns in future years.
Interest rate increase impact: Ratings and, to a smaller extent, indices, perform best during a period of stable but declining interest rates, tight credit spreads and broader global economic prosperity. The reason for this is the correlation between business conditions and ratings demand; when rates increase, refinancing needs slow, and companies might also delay M&A and Capex, further weakening new Ratings demand.
This leads to worse S&P Global financial performance during periods of rising rates, and 1994 - 1995, 1999 - 2000, 2004 - 2006 and 2022 - 2023 serve as historical case studies. Interestingly, in each situation, while there was a decline in S&P Global’s ratings growth, we saw a quick rebound in its prospects, highlighting just how important Ratings is and how mission-critical it is for customers.
How I account for this risk: I decreased S&P Global’s valuation from 28x P/E to 27x P/E. Its track record of bouncing back from tougher rate environments (see 1995 annual report), pricing power and diversified business lines supports its resilience.
Antitrust actions: After reviewing the regulatory response and feedback from the IHS Markit merger in the U.S., the UK and Europe, it’s clear there’s consensus that S&P Global has market concentration and any large-scale acquisitions in the future would be unlikely to pass regulators without asset sales. With IHS Markit, S&P Global was forced to sell its CUSIP Global Services and Leveraged Commentary & Data businesses to keep IHS Markit Index and Market Intelligence products. In the future, I don’t see potential for any more mergers and acquisitions of IHS Markit’s scale, and I reflect this across all growth estimates.
How I account for this risk: Growth estimates only model bolt-on acquisitions in Energy (CERA) and the Market Intelligence division. I suspect current antitrust concerns limit M&A activity for Indices and Ratings.
Potential product liability: The cost of mission-critical products is that failures lead to bad consequences for customers and the broader society, and, over the years, poor and inaccurate ratings have cost S&P Global its reputation and financially. Over the last 10 years, there have been at least 10 settlements and fines, nearly all attributed to Ratings. I view these potential Ratings liabilities as a cost of business and embed them in its operations. Of course, a full-on debt crisis could spur even worse liability repercussions.
How I account for this risk: I include a financial charge of $100 million between 2028 and 2030 in the Ratings division operating-related expenses to account for potential payments.
Business model risk conclusions
Issuer-pay model: The regulatory climate post-financial crisis and the incentive structure of the issuer-pay model mean we must periodically retest whether it has a future. The regulatory overhang thus poses a question: why am I still comfortable holding its shares?
Unintended consequences. The alternative model of investor-pay also has its own downsides that could be worse than issuer-pay. Ratings agencies become incentivised to produce only ratings that appeal to paying investors. Smaller investors would become disadvantaged as they might not be able to afford ratings, leading to ratings coverage shrinkage. Rating agencies could also receive less financial information from issuers, leaving the underlying ratings less accurate for investors. Finally, the investor-pay model could actually favour the big three, especially if there are pricing wars, leading to an even more oligopolistic but smaller market.
For these reasons, I believe the regulatory overhang is unlikely to materialise.
Overview on AI risks: I dedicated section 5 exclusively to addressing the AI risks S&P Global faces and won’t rehash the analysis here. Overall, while there are products more at risk (see section 2 product analysis map), I believe the core base of S&P Global is resilient to AI as we know it today. As we discussed, the benchmark standards model is mission-critical, oligopolistic, with high barriers to entry, particularly in Platts, Indices and Ratings products (76% of 2026 EBIT estimate), and has multiple ways of defending against AI, and is also being further enabled by it.
Let’s next analyse the valuation model for S&P Global.
9. S&P Global’s Valuation
You can access the full S&P Global valuation model here.
Two questions are central to valuing S&P Global: how do earnings and cash flows grow over the next few years, and what earnings or cash flow multiple would you pay for its shares?
Every topic discussed in this deep dive relates back to both questions, and with the earnings growth already mapped out in our growth section, the valuation multiple remains the final piece in valuing S&P Global. To achieve this, I take an earnings multiple approach and compare S&P Global relative to its peer group, the financial market data industry and the S&P 500 index.
S&P Global versus peers
The table below compares S&P Global relative to its peer group, 11 other companies in the financial market data space, on key profitability, growth and valuation multiples.
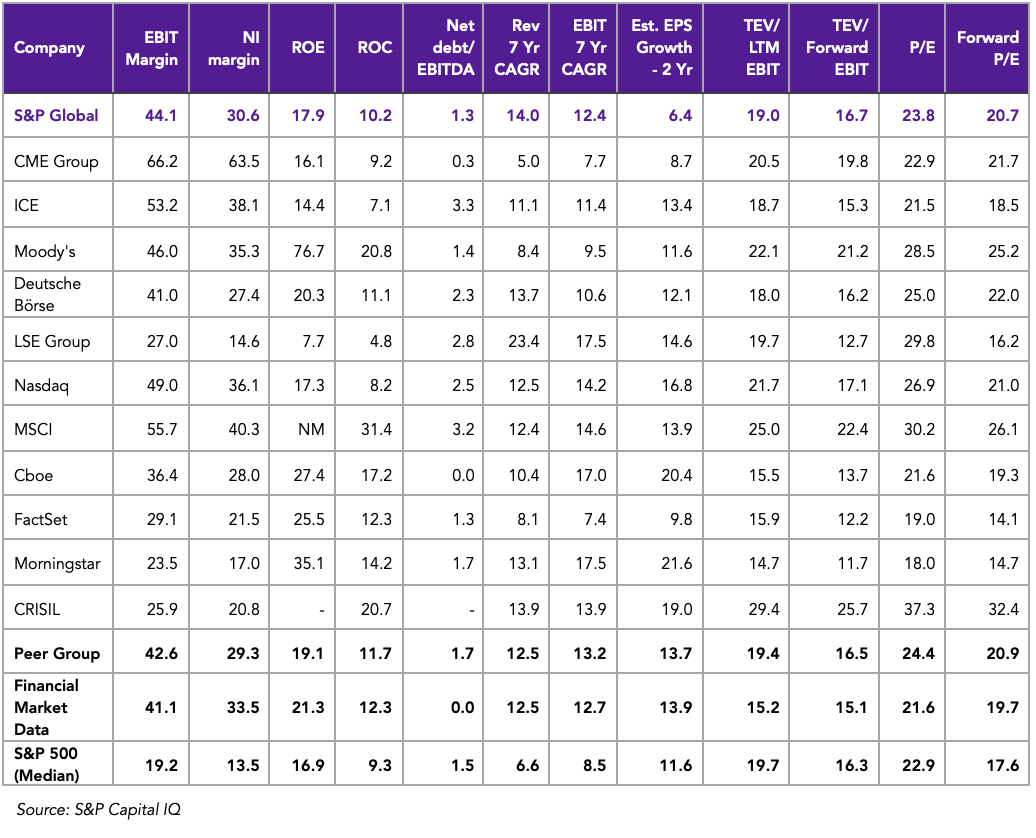
S&P Global versus peers: As shown in the table above, S&P Global is broadly in line with its 11-company peer group. Closer peers like MSCI, a direct competitor in indices, and Moody’s, its main Ratings competitor, trade at slightly higher earnings multiples but also have a faster earnings growth profile based on sell-side consensus and currently have a better profitability profile (return on capital and net profit margin). S&P Global is also less profitable than the exchanges (CME, ICE and Nasdaq) while also being valued on par with them. At first glance, this points towards a valuation either in line with or marginally below peers.
S&P Global versus the S&P 500: My long-term view is that the average globally listed company should trade at 15x, while the average S&P 500 should be priced at 18x earnings. Today, the S&P 500 is priced at 17.6x forward earnings, and the key question is whether S&P Global deserves an earnings multiple at a premium to the S&P 500, and if so, to what extent?
In my opinion, I believe S&P Global deserves a premium, and the key reason for this view is the quality gap between the average company and S&P Global. While S&P Global grows slower than peers, the sheer quality - barriers to entry, market leadership, profitability, and the test of time justifies paying more for S&P Global.
This begs the question: to what extent?
Generally, for comparative reasons, I use the P/E (net profits, GAAP) to value most companies, and I concluded that 27x P/E, equivalent to 20x EV/EBIT or 24x P/FCF, is the appropriate multiple. 27x net profits does seem high, and the reason for this is that roughly 10% of its cost base is amortisation attributable to the IHS Markit acquisition. These are non-cash costs and depress the true cash earnings for S&P Global shareholders. For this reason, the 24x FCF multiple better represents our true valuation multiple, and the table below portrays my valuation estimates through to 2030.

Next, I’ll walk you through a summary of the financial projections and how these lead to the exit market capitalisation and potential return on S&P Global’s shares.
S&P Global revenue
An earlier overview of the division revenue and cost projections through to 2030 is analysed in the growth section.
Summing the division analysis, I split S&P Global’s revenue into its six revenue lines, led by subscription revenue, a category I expect to represent 45.5% of S&P Global’s revenue by 2030.
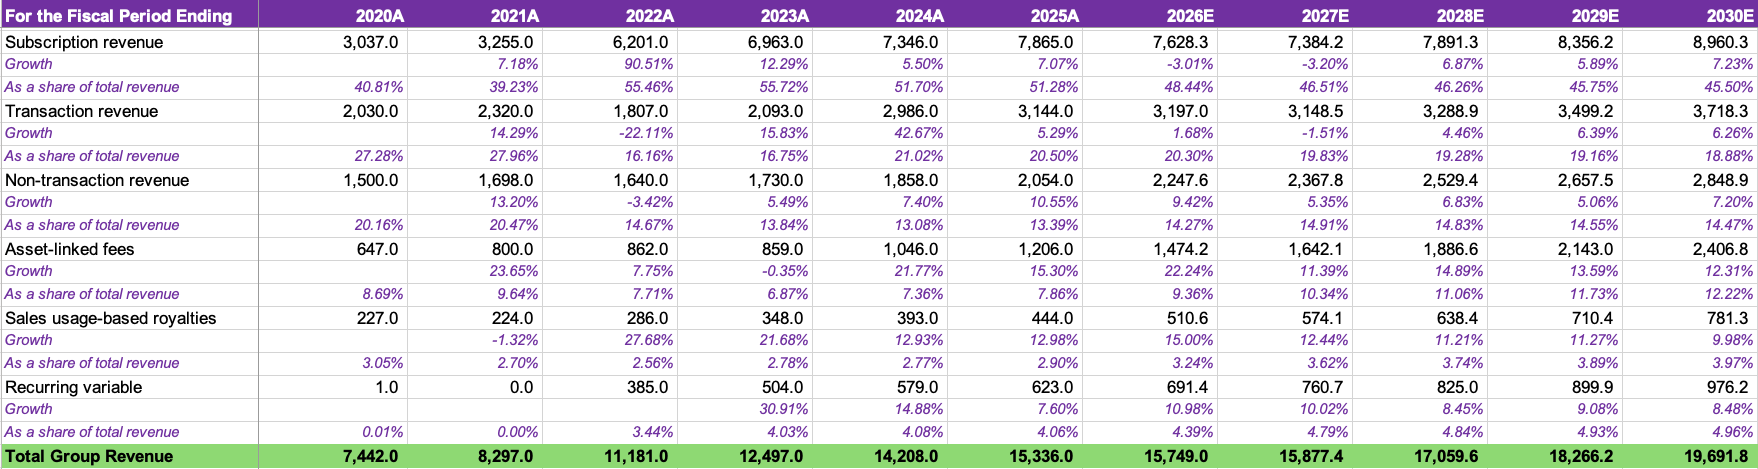
Total group revenue: Between 2025 and 2030, I expect the group’s revenue to grow by 5% annually to $19.7 billion by 2030.
S&P Global costs and operating profits
Depreciation and amortisation: I anticipate improved amortisation costs from the IHS Markit merger for future years, leading to a decrease from 7.7% to 5% of revenue.
The spinoff of Mobility Global has an immediate impact on the cost base in 2026 and the first half of 2027. Beyond that, I see more scope for cost optimisation, particularly across the energy and Market Intelligence divisions.
Altogether, these should lead to operating profits growing by 8.7% annually to 2030, with EBIT margins increasing from 42.2% to 50%.
EBIT to Net income margin
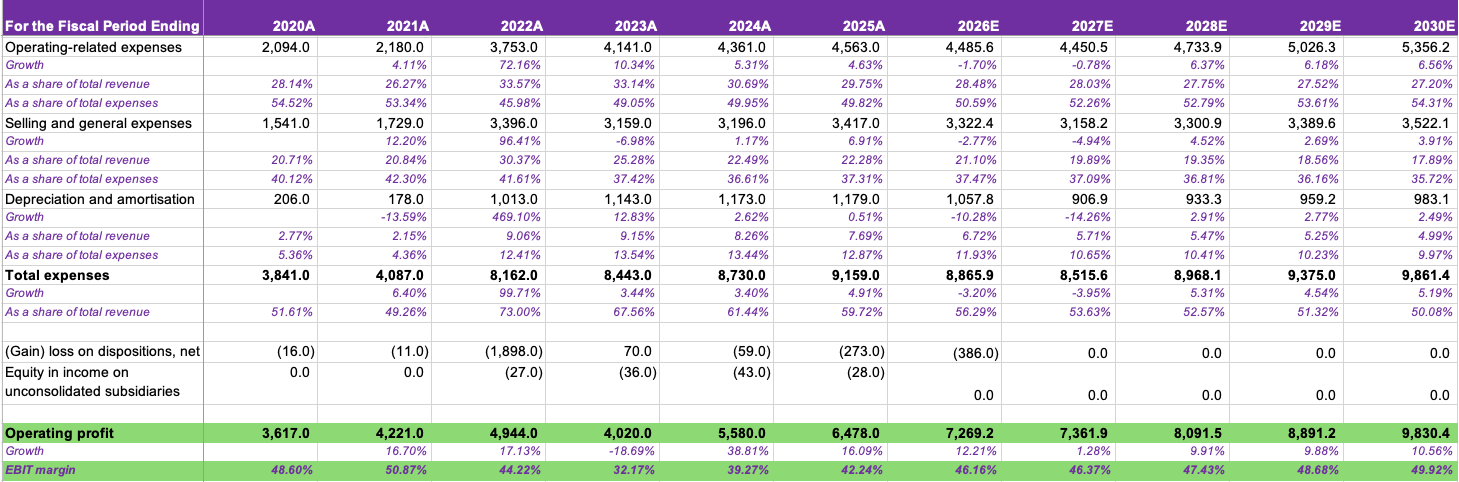
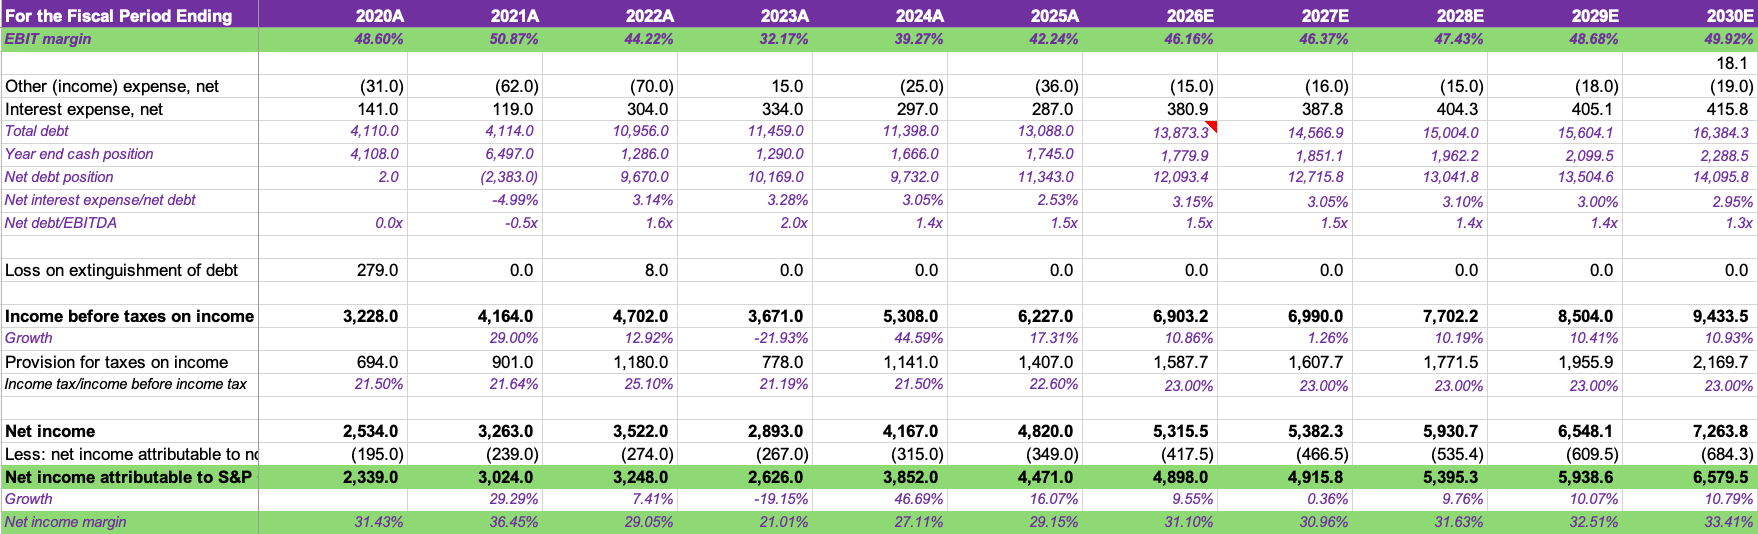
Debt and interest expenses: While S&P Global has some debt capacity, I don’t expect large acquisitions in future years, keeping the net debt/EBITDA level below 1.5x. Interest expenses are well covered.
Income tax: I estimate a 23% tax rate for the investment period
Net income: These estimates lead to a net income growth of 8.6% CAGR, with its margins improving from 29.2% to 33.4%.
Multiples
In line with my multiples analysis, I forecast a 27x P/E over the holding period. Other relevant valuation multiples are included above.

These bring S&P Global to an exit market cap of $177.6 billion, before the effects of shareholder distributions.

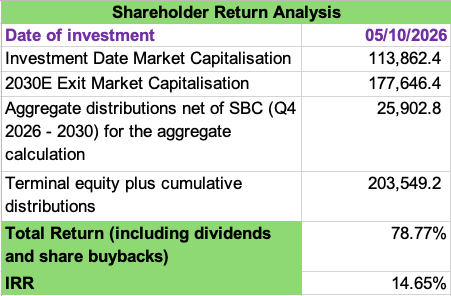
With dividends and net share repurchases, the terminal equity value increases to $203.5 billion, indicating a potential annualised return of 14.7% over the holding period.
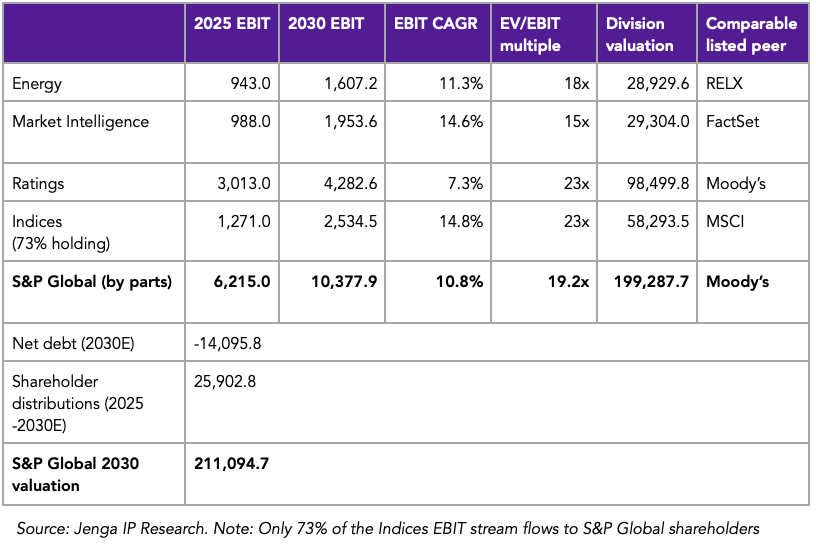
As a reality check on our valuation model, the table above values S&P Global by its parts using my 2030 earnings estimates for each division. I use comparable EV/EBIT multiples from listed peers and, based on the analysis, I estimate S&P Global’s exit sum-of-parts valuation at $211 billion (15.7% IRR), above the core valuation, thus reconfirming our earlier analysis.
As this rounds up to the 15% IRR hurdle, I took a 5% position in S&P Global and expect to maintain a long-term position in its shares.
CRISIL and Mobility Global are two companies associated with S&P Global, and to ensure we have selected the best investment case across the three companies, the next sections take a brief valuation look at both companies.
10. CRISIL Limited Valuation
You can access the full CRISIL valuation model sheet here.
The purpose of researching CRISIL is twofold: gauging its contribution to S&P Global’s financials through non-transaction ratings revenue and checking if its potential IRR is higher than its parent.
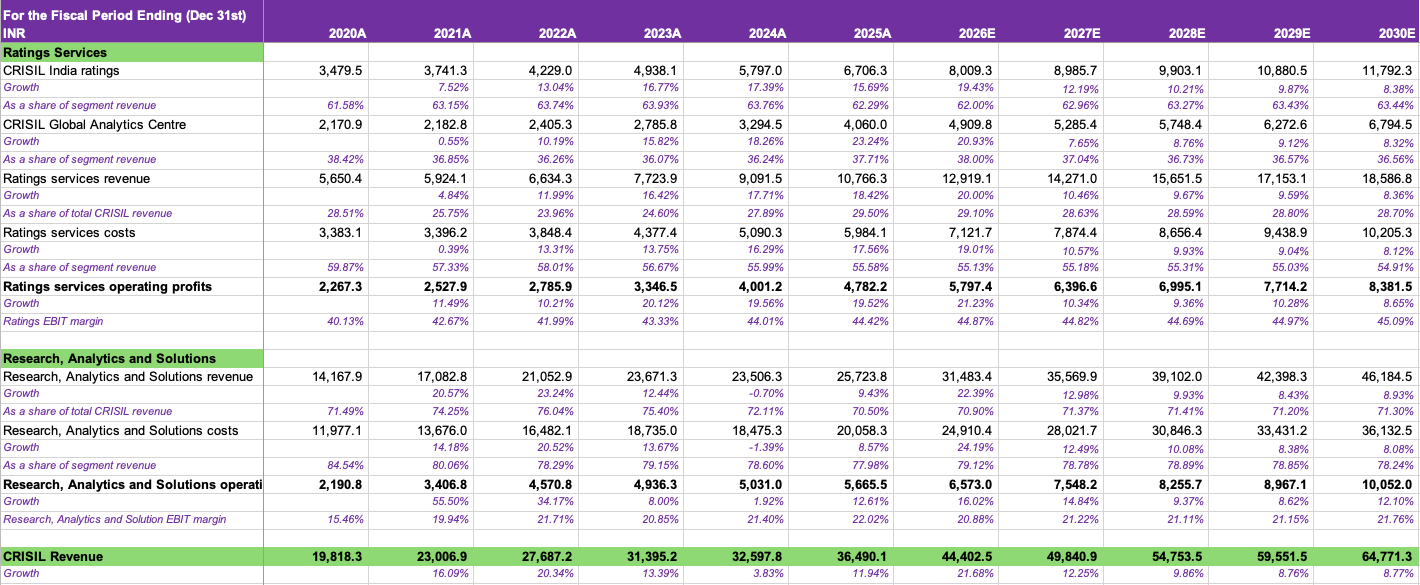
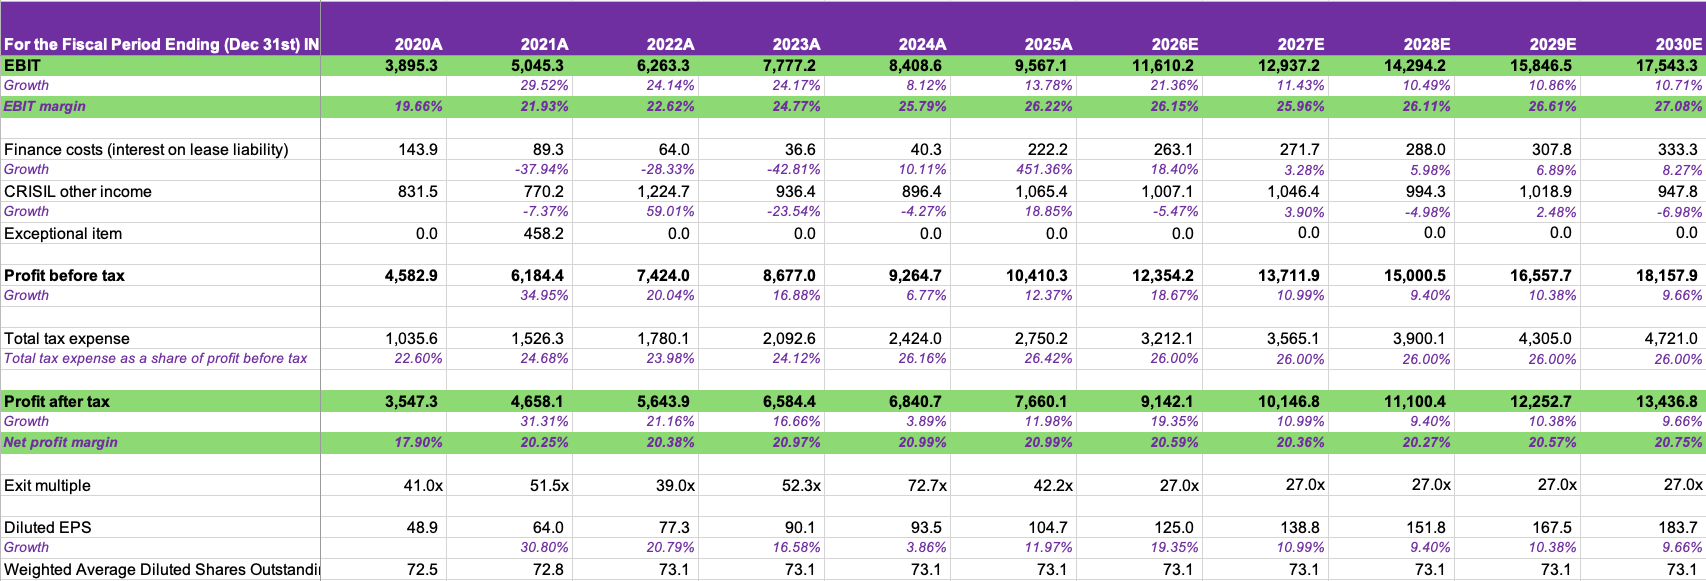
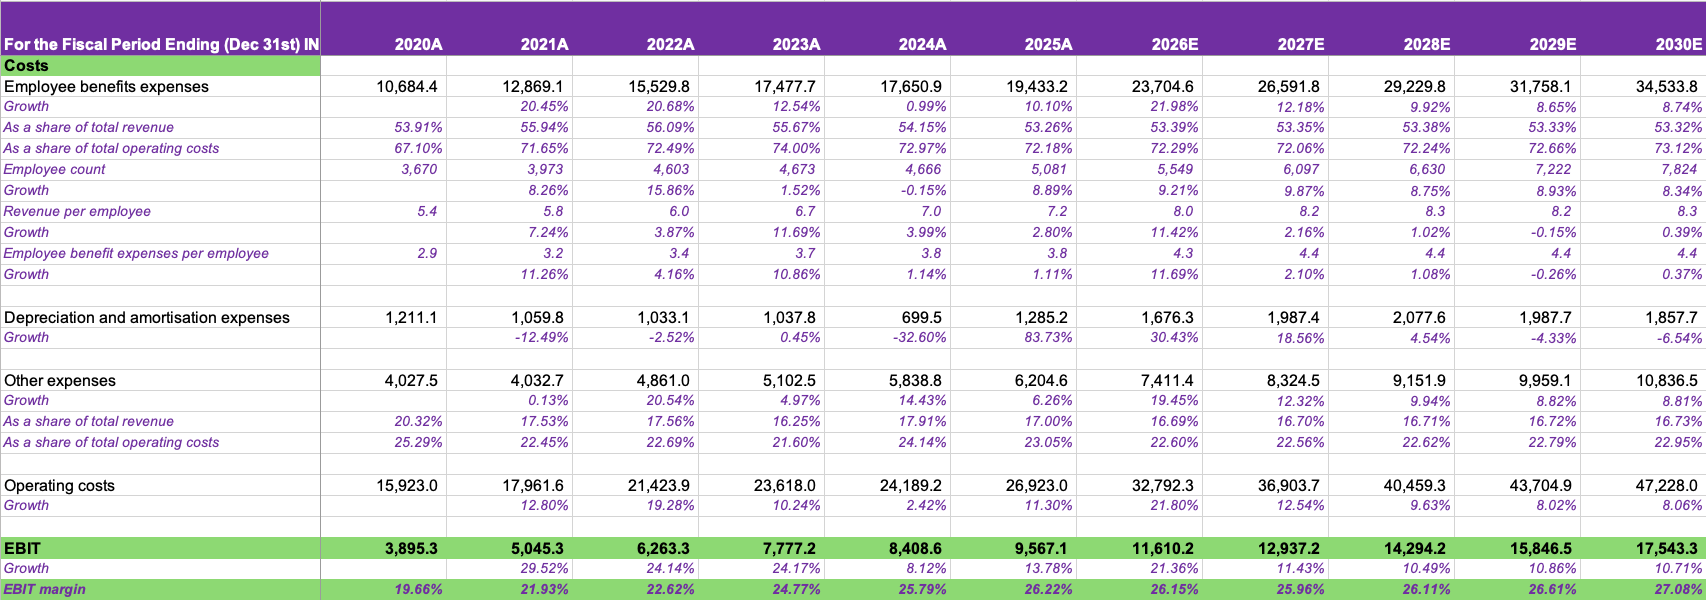

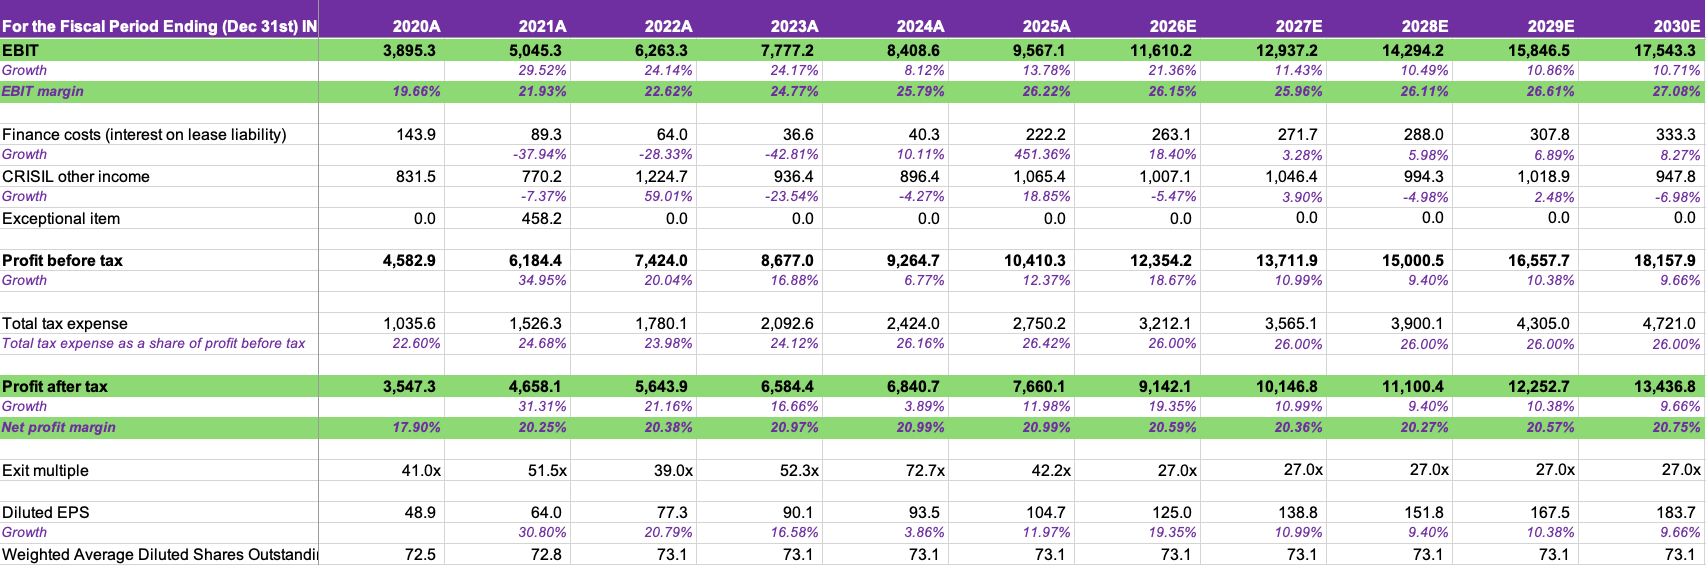

As shown in the final valuation image, I concluded that CRISIL Limited shares have a potential annualised return of just 4.2% over the next 4.25 years, meaning we are much better off owning shares in its parent, S&P Global.
The key difference between the two companies is the starting valuation: 23x P/E at S&P Global versus 37x P/E at CRISIL Limited.
Compared to S&P Global, there are a few differences worth highlighting that support my valuation conclusions.
Weightings to Ratings: Despite having a more concentrated division base, CRISIL actually makes less revenue and operating profits from ratings than S&P Global. The Ratings division is 29% of CRISIL’s revenue and 43% of its EBIT, and within this ratings division is CRISIL Global Analytics Centre, which earns ratings revenue from assisting S&P Global with surveillance. Management says it is priced at a cost-plus margin in line with the rest of CRISIL’s ratings revenue, which is much lower than S&P Global’s revenue.
More competitive diversification efforts: Beyond Ratings, CRISIL has a much lower-quality business across Coalition Greenwich, Integral IQ and CRISIL Intelligence. Combined, these three divisions achieve EBIT margins of 22%, and while we believe this could increase to 24% by 2030, supported by scale and cost efficiency gained from AI, it’s far off from the operating margins seen at S&P Global’s diversification businesses. Beyond the margin, I also believe these businesses are even more challenged by AI than S&P Global’s CERA and Market Intelligence sub-divisions. Generally, they’ve benefited from investment banks and asset managers outsourcing parts of their workflows, including investment research and credit risk analysis (Integral IQ), competitor and client research (Coalition Greenwich), and broader industry and economic research (CRISIL Intelligence). The recently acquired PriceMetrix broadens their analytics to wealth management.
Altogether, there’s a broader correlation with global industry assets under management and analytics operating expenditure. While CRISIL is already building its own AI tools, some of which were discussed in its latest earnings calls, AI ultimately makes some of these likely to be insourced, and I see an overall more competitive market for CRISIL Research, Analytics and Solutions.
Earnings growth: Overall, I believe CRISIL could grow its revenue by 12.2% CAGR, EBIT by 12.9% CAGR, and net profits and EPS by 11.9% CAGR between 2025 and 2030, which is significantly faster than S&P Global. The main reasons for this are the underlying fundamentals of India’s economy and how this could trickle into an extended economic boom for rating agencies. As we discussed in the industry overview section 3, India’s rating market is underpenetrated relative to peers and is weighted towards the biggest issuers.
While I notice less pricing power for the Indian agencies due to new entrants (see here to read some Competition Commission investigations on CRA pricing wars), CRISIL benefits more than peers from brand strength and international recognition and can still maintain better than average growth. For the RAS division, I expect potential acquisitions here, as AI fears could lead to more global targets priced at low valuations.
While I still view CRISIL as high quality, the potential IRR of 4.2% means its investment case is a pass.
11. Mobility Global Valuation
You can access the full Mobility Global Valuation here.
Most spinoffs have a good company, bad company situation. However, this isn’t the case here. This is more of a great company, good company situation, and I believe Mobility Global should be treated as a good company. I see a potential annualised return of 10.9% over the investment period.
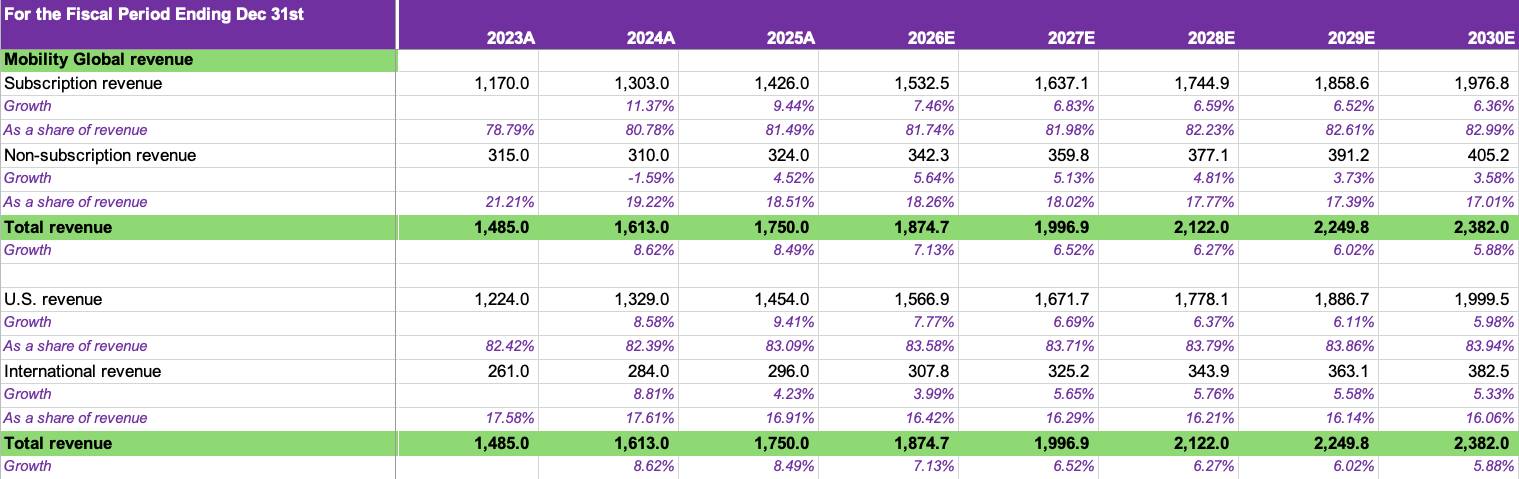
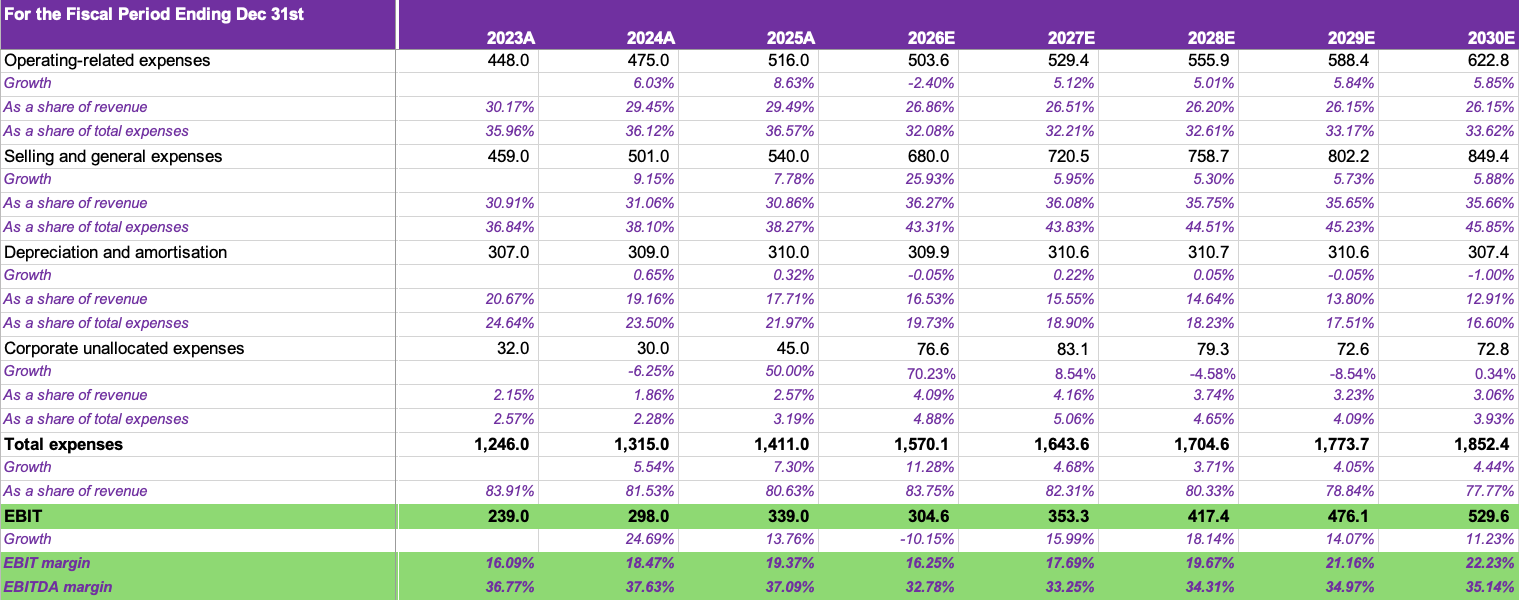
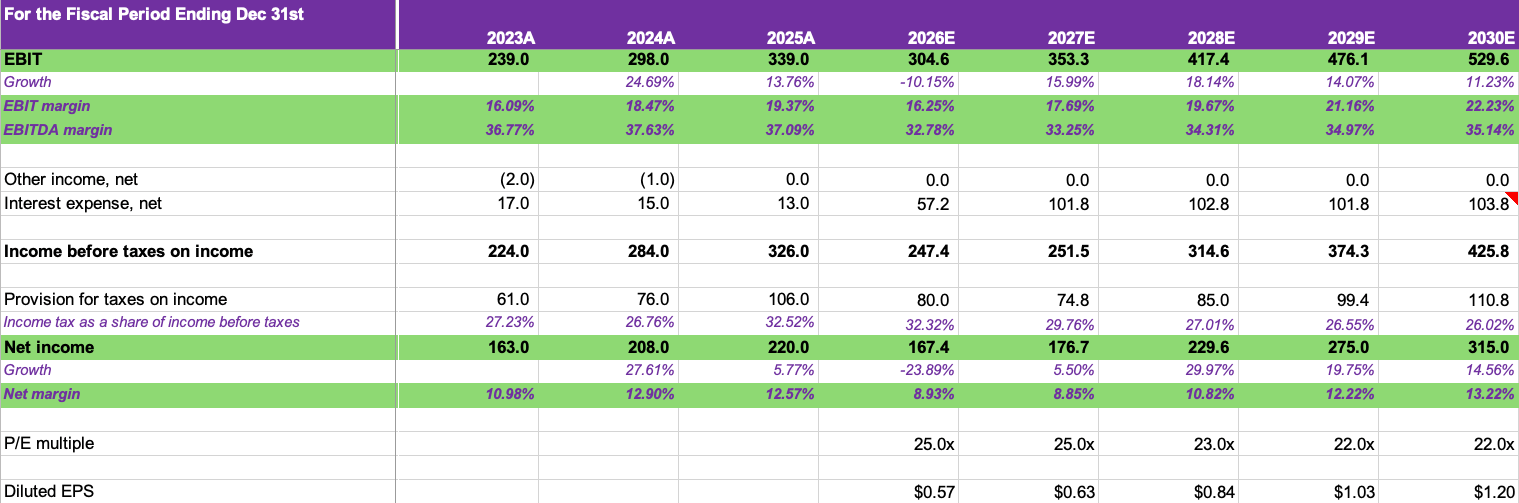
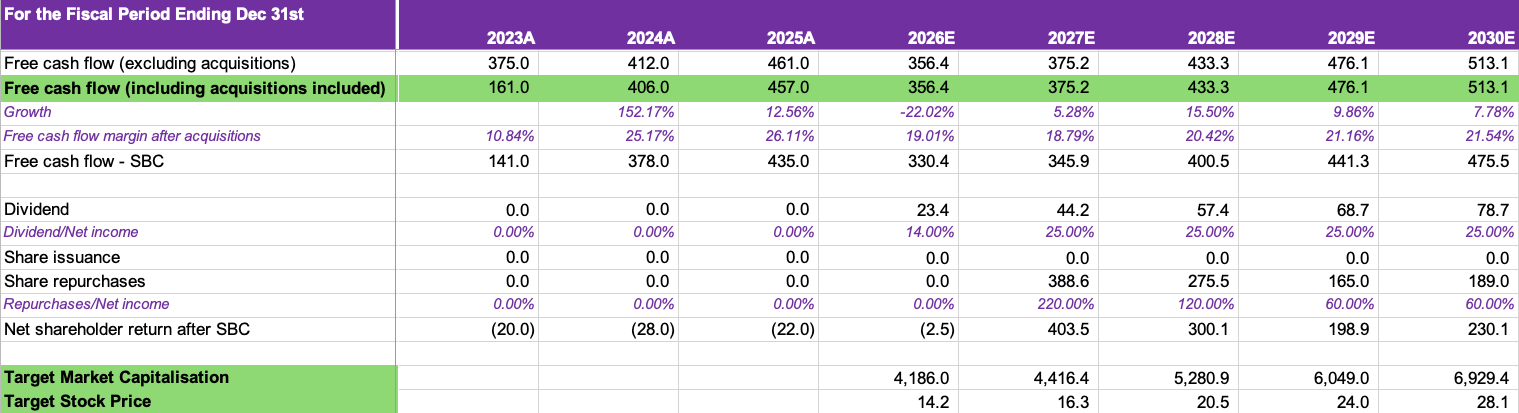
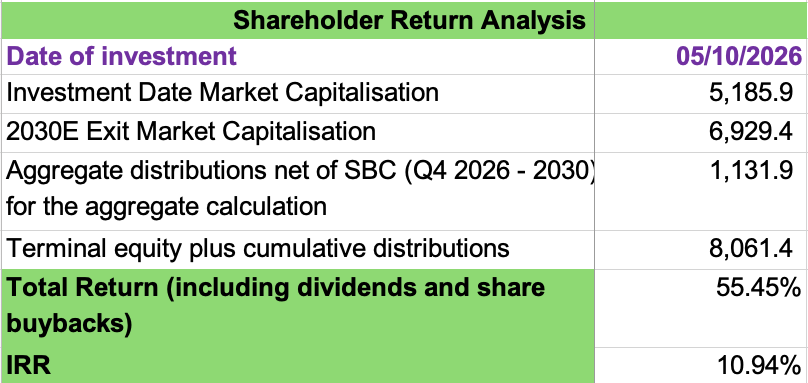
Mobility Global’s management has been quite clear about their medium-term goals:
Grow organically by 7% annually, over the long term
Limited acquisitions
Return excess cash to shareholders through buybacks and a 25% targeted payout ratio
Maintain its data moat, consumer brand, and add bolt-on capabilities to its B2B division
While it is still early days for Mobility Global as a standalone listed company, rereading old documents of Polk Automotive since it acquired Carfax in 1993 points to one thing: Mobility Global is a high-quality, mission-critical and resilient company.
As such, I believe the high quality position (see its Jenga IP Quality score in the Risks section 8) should be supported with a premium earnings multiple of 22x exit P/E.
At my current earnings expectations, a market cap of $4.45 billion offers a 15% IRR entry point, and I maintain Mobility Global on the watchlist for this scenario.
12. Conclusion
Throughout the deep dive into S&P Global, I’ve examined its business through several lenses: product scope, industry, AI, economics, risks and compared the valuation to peers and, more in-depth, the associated companies, Mobility Global and CRISIL Limited.
Each of these pointed towards a high-quality company and reconfirmed my initial thesis for S&P Global. Of course, there are some risks uncovered during the research: AI on CERA and Kensho Data and Platforms, Ratings cyclicality, and index pricing pressure. All investments have risks, and the main question is whether we are compensated enough to take on the risks. At 23x earnings and a potential 15% annualised return over the 4-5 years, based on my estimates, I believe S&P Global meets what we look for, and I initiated a 5% position in its shares.
During my research, S&P Global’s management stated they are reviewing Kensho Data and Platforms with a planned sale of its business, excluding RatingsDirect and RatingXpress. While I prefer that management keep the division given the product, quality and attractive economics, everything has a price, and I estimate that the sale perimeter currently represents 45% of Market Intelligence’s EBIT ($500 million on 2026e). I believe a sale price of 14x EBIT, $7 billion, would be an attractive price for shareholders. I’ll be following the developments closely.